Master Charts Trading - Stock Market Indicators & Trade Alerts
Connect To Us!
  • MasterChartsTrading
  • Blog
  • Sign-Up
  • Members
    • Elite Trading Blog
    • Stock Speculator Blog
    • Training Library >
      • Basics of Trading
      • Risk & Trading Psych
      • Trend Identification
  • Help
    • Hall of Fame
    • Social
    • About Us
    • Contact
    • FAQs
    • Disclaimer
    • Refund Policy
    • Privacy Policy
    • What We Trade
    • Newsletter samples

Stock Market Recap: May 5, 2017 - SPY QQQ IWM XLY XLI XLV XLE XLU IYR XLF UUP GLD GDX USO UNG

5/7/2017

2 Comments

 
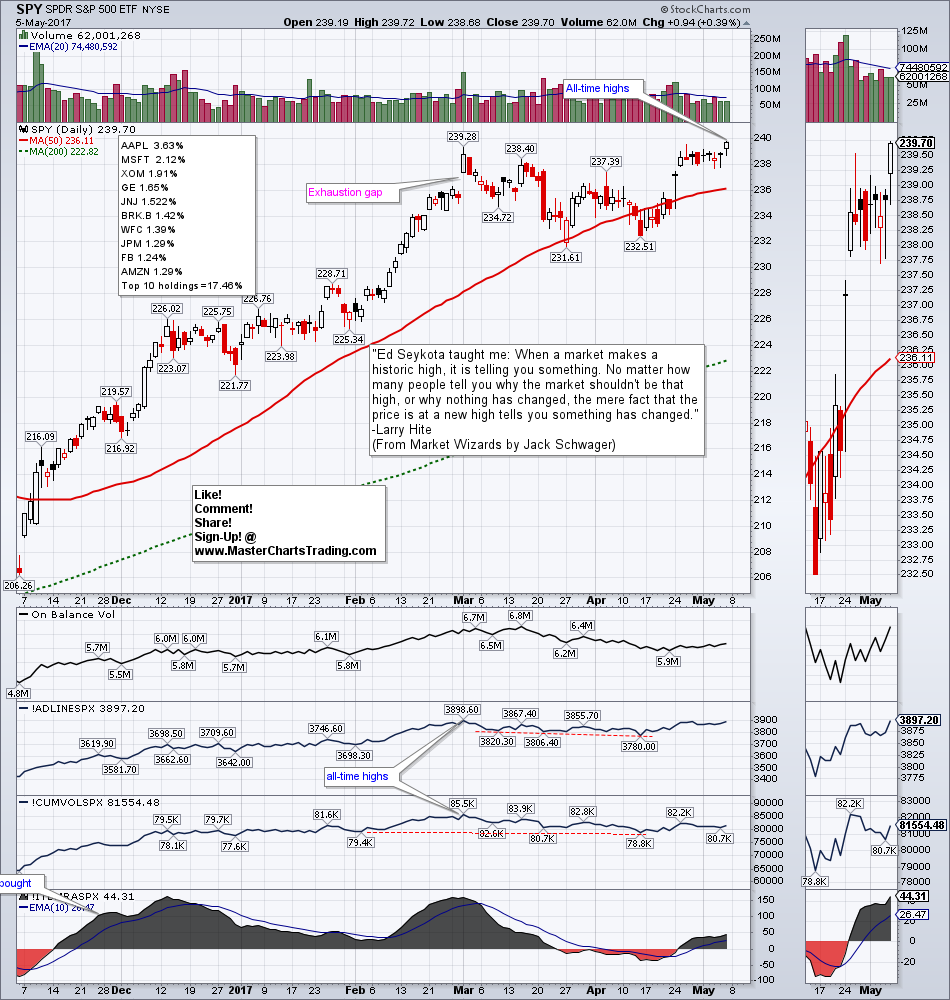
​•Stock set new record highs | QQQ leads as Apple, Facebook, Alphabet and Microsoft hit new highs | Seasonality – sell in May and go away? | Small caps retesting breakout | Industrials, Technology, Discretionary, and Health Care lead | Real Estate prints a Hammer candlestick with a follow-through | Utilities also very strong | Financials may again retest April lows | Junk Bonds pull back from all-time highs
•Investment-grade bonds slide for the week, but are not yet done for and could still rally

•US Dollar at a critical juncture | Break below current levels could mean a retest of November lows | Or maybe this is a cup and handle pattern on weekly charts that will result in new multi-year highs? | Euro gains for the 4th straight week | British Pound may be rolling over back down | Dollar gains vs. the Yen

•Gold has a terrible week despite a weaker dollar | GDX makes a lower low below the March lows | Small bullish divergence leaves a possibility of a bounce, but 52-week lows are not that far off

•Oil makes a fresh 2017 low, but late week buying helps print a hammer-like candlestick | Bearish divergence plays out on XLE | XLE somewhat oversold after a 15% slide since December | XLE is also is at a record un-correlation from the general market

•Natural gas trades sideways

Watch this video on YouTube
Picture
Ready to trade? Sign-up Today
2 Comments
robert giorgini
5/7/2017 07:36:46 am

you always use daily charts which i think have to much volubility

as a retired investor i like monthly charts for INVESTING and then at month end compare with weekly chart.

nice to view your commentary for INVESTORS.

ENJOY YOUR CHARTS, THANK YOU

Reply
Alex link
5/8/2017 04:11:26 pm

Thanks for the good word!

I agree that daily charts sometimes are a bit unclear because of the day to day volatility.
As part of the subscription service, I also offer the Dividend Aristocrats page which uses weekly chars exclusively for the longer-term holds.

Alex

Reply


Leave a Reply.

    Picture
    Picture
    Subscribe to our mailing list!
    Picture
    Picture

    Archives

    February 2023
    January 2023
    December 2022
    November 2022
    October 2022
    September 2022
    August 2022
    July 2022
    June 2022
    May 2022
    April 2022
    March 2022
    February 2022
    January 2022
    December 2021
    November 2021
    October 2021
    September 2021
    August 2021
    July 2021
    June 2021
    May 2021
    April 2021
    March 2021
    February 2021
    January 2021
    December 2020
    November 2020
    October 2020
    September 2020
    August 2020
    July 2020
    June 2020
    May 2020
    April 2020
    March 2020
    February 2020
    January 2020
    December 2019
    November 2019
    October 2019
    September 2019
    August 2019
    July 2019
    June 2019
    May 2019
    April 2019
    March 2019
    February 2019
    January 2019
    December 2018
    November 2018
    October 2018
    September 2018
    August 2018
    July 2018
    June 2018
    May 2018
    April 2018
    March 2018
    February 2018
    January 2018
    December 2017
    November 2017
    October 2017
    September 2017
    August 2017
    July 2017
    June 2017
    May 2017
    April 2017
    March 2017
    February 2017
    January 2017
    December 2016
    November 2016
    October 2016
    September 2016
    August 2016
    July 2016
    June 2016
    May 2016
    April 2016
    March 2016
    February 2016
    January 2016
    December 2015
    November 2015
    October 2015
    September 2015
    August 2015
    July 2015
    June 2015
    May 2015
    April 2015
    March 2015
    February 2015
    January 2015
    December 2014
    November 2014
    October 2014
    September 2014
    August 2014
    June 2014
    May 2014
    April 2014
    March 2014
    February 2014
    January 2014

    RSS Feed

  All information on MasterChartsTrading.com is for educational and entertainment purposes only, and should not be construed as a recommendation to buy, sell or sell-short said securities. Read full disclaimer.