Thursday, April 10, 2014
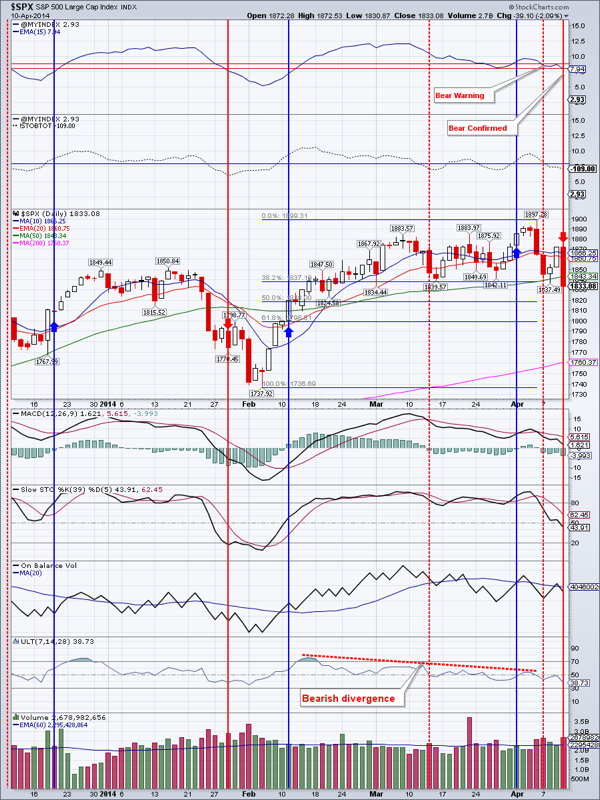
Stocks Breakdown. Market Breadth in Bear Confirmation.
All indices had a bad day. NASDAQ and IWM both fall out of bed with a 3 and 2.78 percent loss respectively. While the Blue Chips “only” lost 1.62%. All indices are now below the 50 day moving average (DMA). $SPX has some initial support in the 1820 -1800 area from the Fibonacci retracement lines. For NASDAQ there is good initial support at 3968 from the February low.
Market Breadth Index has now officially confirmed that a Bearish period in the stock market is upon us. When will this corrective period be over? Once the buying pressure comes back and there will be evidence of it in the market breadth. I will be sure to blog about it! For now, the direction is down. We have opened a very small position in SPXU to play this potential correction.
TLT predictably had a very good day and gained almost a percent on above average volume. The topping candle from March 31 is still in play though. I would like to ideally see a close above $110.78 very soon.
EEM finally is showing some signs of resistance. It had an Inside day today. A close below $41.73 would begin the throwback I was talking about for the past few days. A pullback to the $39-40.50 area would be very healthy and a good buying opportunity once there is evidence of a turnaround.
Gold continued its rebound and tacked on about ½ of a percent, to close at $1318.10. It has now closed above the 50 DMA for the last two days in a row …
…GDX, however lost almost 2% and had an Inside day. GDX now needs to close above $25.34 to confirm this rally. This would also put GDX over the 50 DMA.
IYR may have run into resistance. First support is very close at $67.70, but a throwback to the 50 DMA is possible.
Oil is preparing to rally to its March peak at $105.22, but may have run out of steam and needs to digest for a few days before doing so.
Natural gas closed above $4.59 and confirmed strength in this rebound. It is now likely to retest the 50 DMA currently at $4.75
Bottom line: All indices are now in the correction mode.
Open positions: GDX, NUGT, IYR, TLT, EEM
Hedging positions: SPXU


 RSS Feed