Master Charts Trading - Stock Market Indicators & Trade Alerts
Connect To Us!
  • MasterChartsTrading
  • Blog
  • Sign-Up
  • Members
    • Elite Trading Blog
    • Stock Speculator Blog
    • Training Library >
      • Basics of Trading
      • Risk & Trading Psych
      • Trend Identification
  • Help
    • Hall of Fame
    • Social
    • About Us
    • Contact
    • FAQs
    • Disclaimer
    • Refund Policy
    • Privacy Policy
    • What We Trade
    • Newsletter samples

Stocks Look Precarious, While Bonds Near a Breakout

3/25/2014

0 Comments


Monday, March 24, 2014

Stocks Look Precarious, While Bonds Near a Breakout

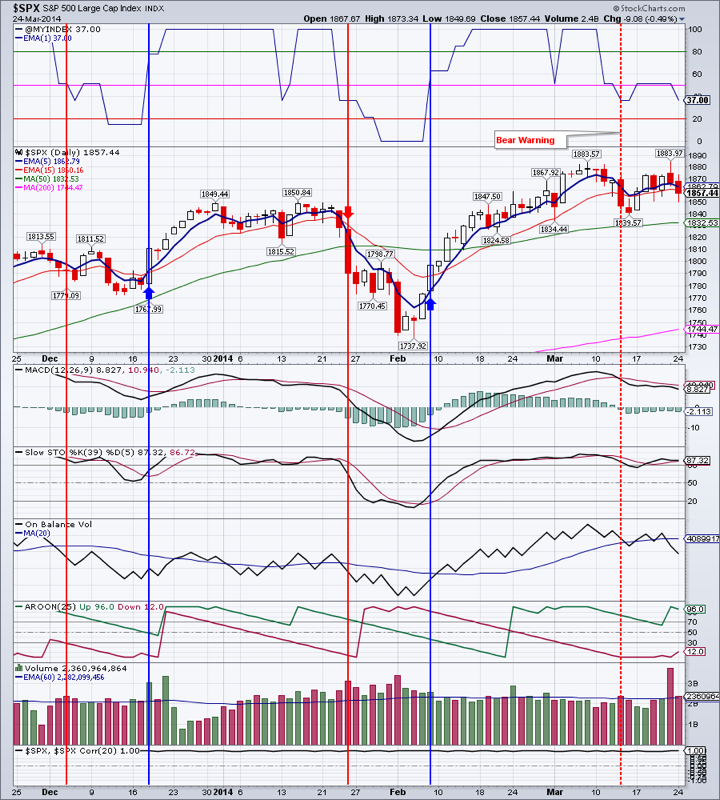
  Major indices dropped on heavy volume for a second day in row. NASDAQ was especially hard hit, closing just above the 50 day moving average (DMA) - a line in the sand where many investors will sell.

  Market Breadth Index, the $VMBI, is confirming this decline and we further cut our stock holdings

  TLT gained in the face of market selling. It currently stands only 18 cents away from closing at 10 month high. On Balance Volume is showing continuing interest in Treasuries. It should also be noted that a Golden Cross (50 DMA crossing above the 200 DMA) occurred in TLT on March 5th.

  Emerging markets bucked the trend and gained almost 1 percent. There is a still lot of overhead resistance in the $39.40-40.22 area. EEM needs to close above its 200 DMA to prove itself before we get interested again.

  Gold was a big looser today. It closed down almost 2% to end at $1309 on a bearish candlestick and above average volume. These all point to lower prices ahead. The 50 DMA lies just below at $1300.48. Should gold close below it, we will likely cut our GDX holdings.

  GDX lost 4.68% and closed below its 50 DMA. This is an ominous sign for both gold and the miners.

  IYR sold-off together with the markets. It is looking rather unsteady also. The momentum indicators (MACD, Stochastic) have rolled over in early March. On Balance Volume is still positive, so we are not ready to call the top in IYR just yet.

  Natural Gas may have found at least a temporary support. We have pared our position in DGAZ and locked in profits. A rebound to somewhere between $4.50-4.80 is likely.

  Oil is knocking at the 200 DMA, but is yet unable to break above $100. Momentum is still to the downside. A re-test of January low is likely.


Open positions: GDX, IYR, TLT, ETV (very small), DVY (very small)

 Hedging positions: TZA, SDOW, DGAZ (took profits)


Picture
Ready to trade? Sign-up Today
0 Comments


Leave a Reply.

    Picture
    Picture

    Subscribe to our mailing list!

    * indicates required
    /* real people should not fill this in and expect good things - do not remove this or risk form bot signups */

    Intuit Mailchimp

    Click to set custom HTML
    Picture
    Picture

    Archives

    January 2025
    December 2024
    November 2024
    October 2024
    September 2024
    August 2024
    July 2024
    June 2024
    May 2024
    April 2024
    March 2024
    February 2024
    January 2024
    December 2023
    November 2023
    October 2023
    September 2023
    August 2023
    July 2023
    June 2023
    May 2023
    April 2023
    March 2023
    February 2023
    January 2023
    December 2022
    November 2022
    October 2022
    September 2022
    August 2022
    July 2022
    June 2022
    May 2022
    April 2022
    March 2022
    February 2022
    January 2022
    December 2021
    November 2021
    October 2021
    September 2021
    August 2021
    July 2021
    June 2021
    May 2021
    April 2021
    March 2021
    February 2021
    January 2021
    December 2020
    November 2020
    October 2020
    September 2020
    August 2020
    July 2020
    June 2020
    May 2020
    April 2020
    March 2020
    February 2020
    January 2020
    December 2019
    November 2019
    October 2019
    September 2019
    August 2019
    July 2019
    June 2019
    May 2019
    April 2019
    March 2019
    February 2019
    January 2019
    December 2018
    November 2018
    October 2018
    September 2018
    August 2018
    July 2018
    June 2018
    May 2018
    April 2018
    March 2018
    February 2018
    January 2018
    December 2017
    November 2017
    October 2017
    September 2017
    August 2017
    July 2017
    June 2017
    May 2017
    April 2017
    March 2017
    February 2017
    January 2017
    December 2016
    November 2016
    October 2016
    September 2016
    August 2016
    July 2016
    June 2016
    May 2016
    April 2016
    March 2016
    February 2016
    January 2016
    December 2015
    November 2015
    October 2015
    September 2015
    August 2015
    July 2015
    June 2015
    May 2015
    April 2015
    March 2015
    February 2015
    January 2015
    December 2014
    November 2014
    October 2014
    September 2014
    August 2014
    June 2014
    May 2014
    April 2014
    March 2014
    February 2014
    January 2014

    RSS Feed

  All information on MasterChartsTrading.com is for educational and entertainment purposes only, and should not be construed as a recommendation to buy, sell or sell-short said securities. Read full disclaimer.