Master Charts Trading - Stock Market Indicators & Trade Alerts
Connect To Us!
  • MasterChartsTrading
  • Blog
  • Sign-Up
  • Members
    • Elite Trading Blog
    • Stock Speculator Blog
    • Training Library >
      • Basics of Trading
      • Risk & Trading Psych
      • Trend Identification
  • Help
    • Hall of Fame
    • Social
    • About Us
    • Contact
    • FAQs
    • Disclaimer
    • Refund Policy
    • Privacy Policy
    • What We Trade
    • Newsletter samples

The End of the World is to Be Postponed

3/4/2014

0 Comments


Monday, March 4, 2014
The End of the World is to Be Postponed
It seemed as if the world was ending at the open today. Headlines of Russia invading Ukraine dominated the airways and the internet. Yet, by the close it was clear that markets were surprisingly resilient. They absorbed and priced-in the news, forming hammer-like candlesticks, which indicates good buying pressure. Mind you, all stock indices still closed in the red, but objectively, the losses were muted.
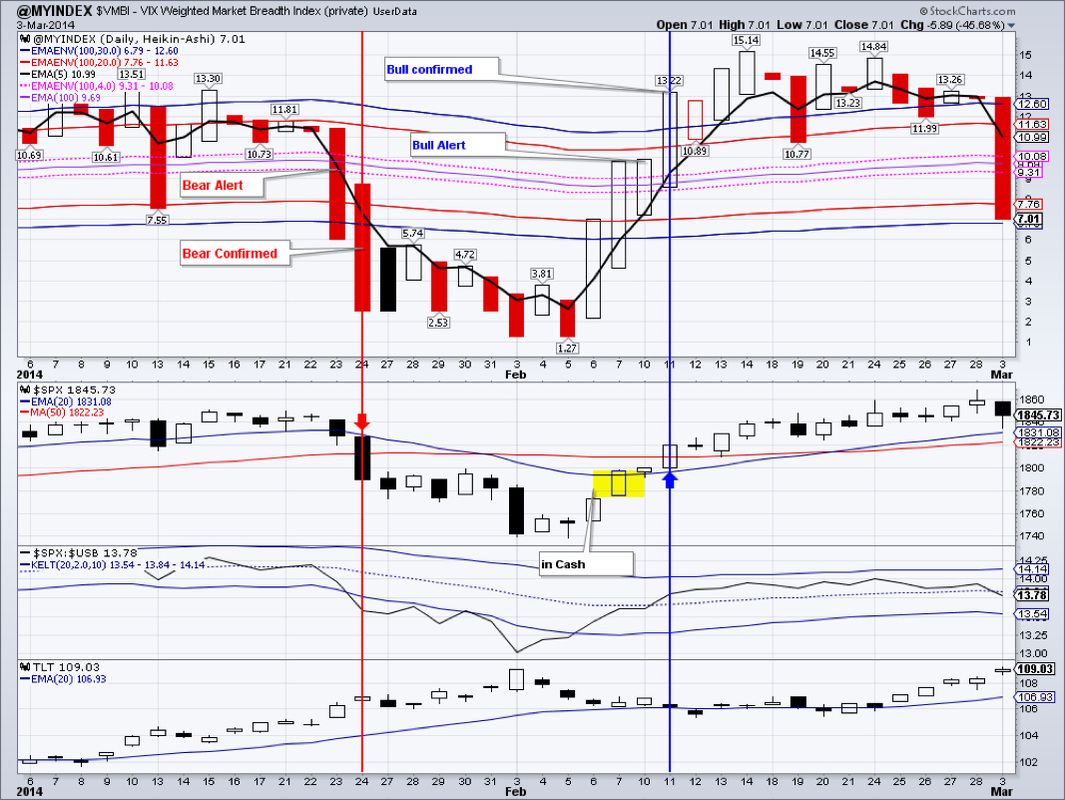
Market Breadth Index, the $VMBI, closed in the moderately bearish territory. Its eMA is still in the bullish territory, albeit falling. The sell-off was not strong enough to trigger a bear alert just yet.
TLT gapped up at the open and gained 0.67% overall. It's only a hairbreadth away from closing above its February peak of $109.07 (dividends removed). This would be bullish for treasuries and likely bearish for the stock market.
Gold and gold miners were the clear winners. Both gold and the miners tacked on about 1.63%. Gold closed at $1350, while GDX finished at $26.30. Gold seems to have cleared the weakness of the past 3 days by closing above $1345.60. Next strong resistance levels are at $1361.80 and $1375.40. Overall gold is in a clear uptrend and it would take a close below its 20 day eMA to call this uptrend into question.
IYR gapped lower at the open, but managed to completely reverse the fall and close in the black - attesting to the strength of the stock market. It also closed above resistance dating back to July last Friday. This bull run is likely to continue. First support is set at around $67.
Emerging markets, especially Russia, took it on the chin today. RSX plunged by 6.87%, while EEM showed resilience and only lost 1.77%. We have exited our emerging markets trade for now. EEM should close above its 200 DMA for us to consider revisiting this trade.
We are long: GDX, IYR, TLT, DVY, ETV

Picture
Picture
Ready to trade? Sign-up Today
0 Comments


Leave a Reply.

    Picture
    Picture
    Subscribe to our mailing list!
    Picture
    Picture

    Archives

    February 2023
    January 2023
    December 2022
    November 2022
    October 2022
    September 2022
    August 2022
    July 2022
    June 2022
    May 2022
    April 2022
    March 2022
    February 2022
    January 2022
    December 2021
    November 2021
    October 2021
    September 2021
    August 2021
    July 2021
    June 2021
    May 2021
    April 2021
    March 2021
    February 2021
    January 2021
    December 2020
    November 2020
    October 2020
    September 2020
    August 2020
    July 2020
    June 2020
    May 2020
    April 2020
    March 2020
    February 2020
    January 2020
    December 2019
    November 2019
    October 2019
    September 2019
    August 2019
    July 2019
    June 2019
    May 2019
    April 2019
    March 2019
    February 2019
    January 2019
    December 2018
    November 2018
    October 2018
    September 2018
    August 2018
    July 2018
    June 2018
    May 2018
    April 2018
    March 2018
    February 2018
    January 2018
    December 2017
    November 2017
    October 2017
    September 2017
    August 2017
    July 2017
    June 2017
    May 2017
    April 2017
    March 2017
    February 2017
    January 2017
    December 2016
    November 2016
    October 2016
    September 2016
    August 2016
    July 2016
    June 2016
    May 2016
    April 2016
    March 2016
    February 2016
    January 2016
    December 2015
    November 2015
    October 2015
    September 2015
    August 2015
    July 2015
    June 2015
    May 2015
    April 2015
    March 2015
    February 2015
    January 2015
    December 2014
    November 2014
    October 2014
    September 2014
    August 2014
    June 2014
    May 2014
    April 2014
    March 2014
    February 2014
    January 2014

    RSS Feed

  All information on MasterChartsTrading.com is for educational and entertainment purposes only, and should not be construed as a recommendation to buy, sell or sell-short said securities. Read full disclaimer.