Master Charts Trading - Stock Market Indicators & Trade Alerts
Connect To Us!
  • MasterChartsTrading
  • Blog
  • Sign-Up
  • Members
    • Elite Trading Blog
    • Stock Speculator Blog
    • Training Library >
      • Basics of Trading
      • Risk & Trading Psych
      • Trend Identification
  • Help
    • Hall of Fame
    • Social
    • About Us
    • Contact
    • FAQs
    • Disclaimer
    • Refund Policy
    • Privacy Policy
    • What We Trade
    • Newsletter samples

Video market recap February 13, 2015 - $SPY $QQQ $NYA $TLT $GLD $GDX $UNG

2/13/2015

0 Comments

 
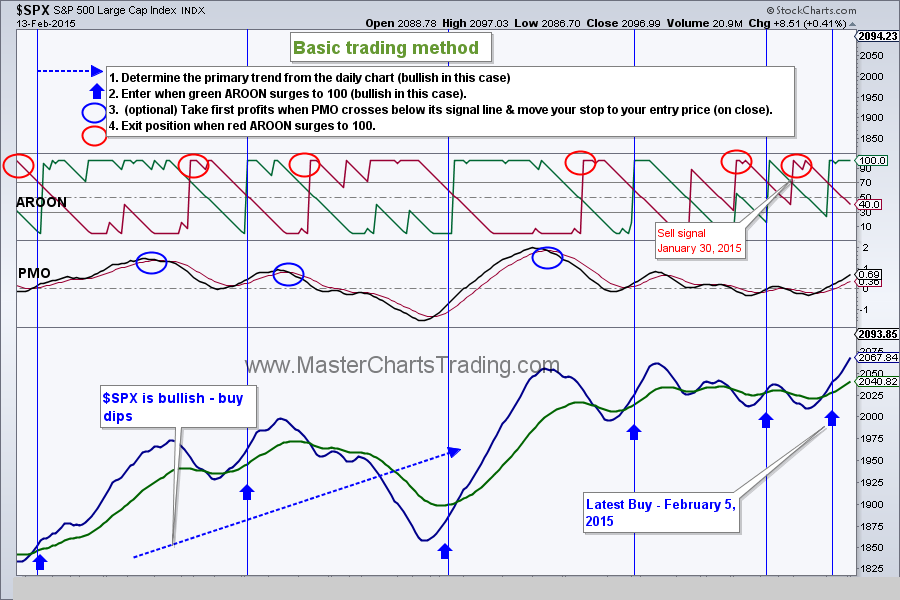
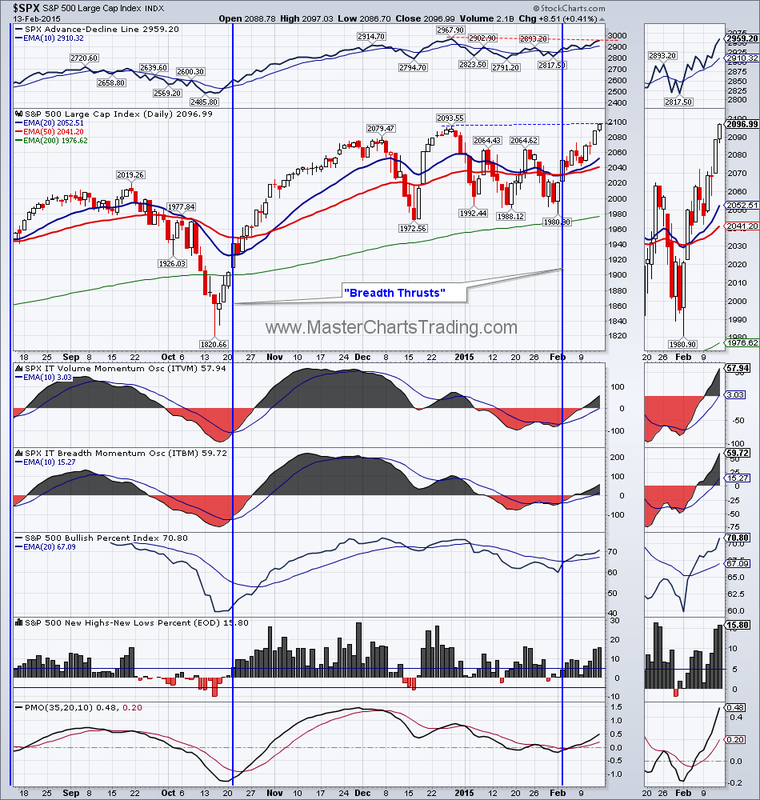
www.MasterChartsTrading.com Friday, February 13, 2015 Weekly Market Recap.

         Watch this week's video here
Last week I mentioned that we were more likely to get a bullish resolution rather then a bearish one from the trading range that the S&P 500 has been stuck in for the past few months. We indeed got our bullish resolution on February 10 with a close above 2065. Since then, most major indices hit new all-time highs. The indices are not yet overbought and new highs are likely to continue. Charts here and here for $SPX

Picture
       The same goes for themarket breadth – its bullish and not “overbought”. There is an ever so small bearish divergence between $SPX and its AD Line – only a few points. I am not sure it’s even worth mentioning. 

Picture
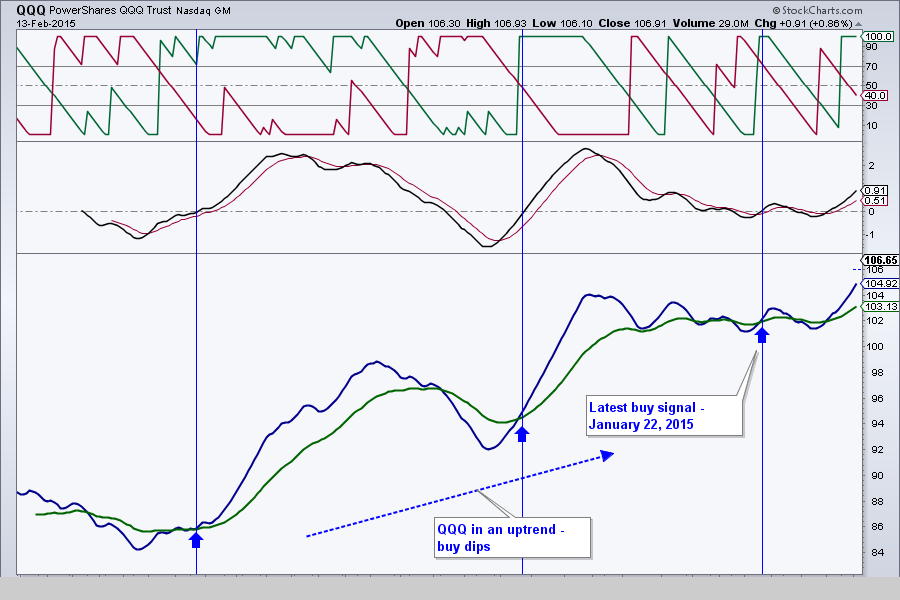
The NASDAQ, after dragging its feet, suddenly surged and became a market leader. QQQ hit a new high yesterday, while $SPX and the Russell 2000 small cap index did the same today.
Picture
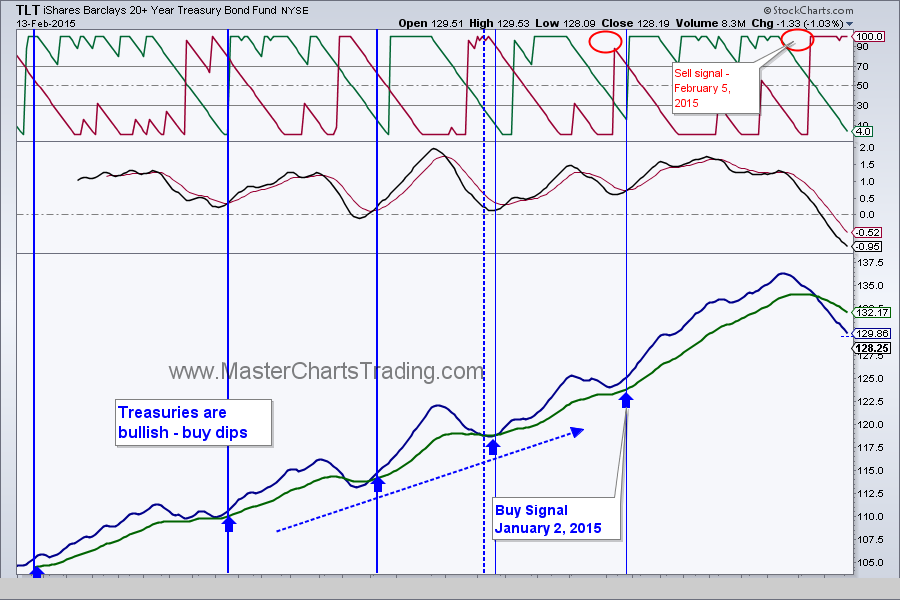
Selling in bonds extended as TLT lost almost 3% this week. TLT is down over 7% from its all-time high on January 30th. Today TLT closed below its 50 day moving average – an ominous sign of more selling to come, especially if Tuesday it closes below the 50 DMA again. I still consider this pullback in bonds a normal correction within a bigger uptrend. 
Picture
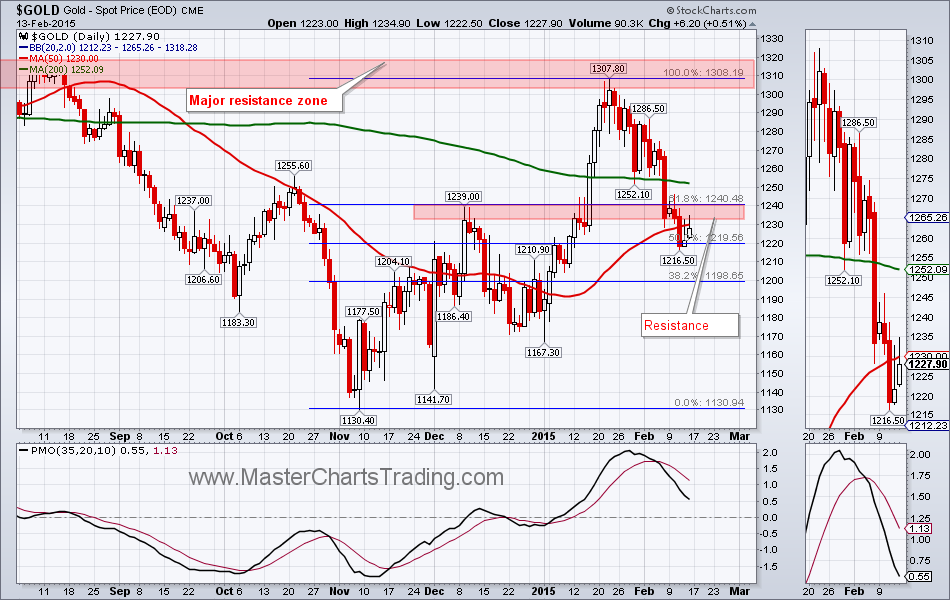
Gold reached a 50% Fibonacci retracement on February 11, but remains below both the 200 and the 50 day moving averages. In fact it closed below the 50 DMA for 3 day in a row now. There is clear resistance for gold in the $1238 area. 
Picture
       GLD went on our short signal on February 6th.

Picture
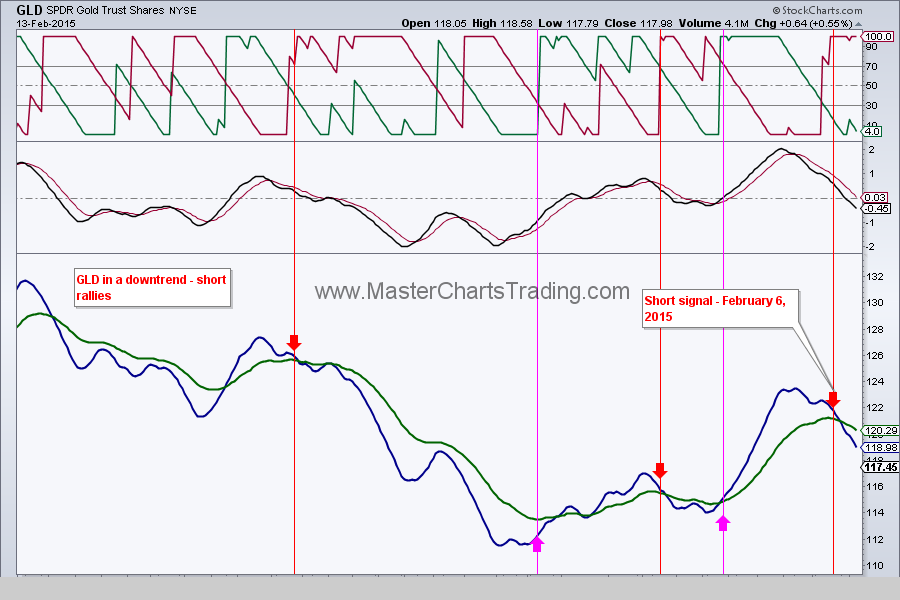
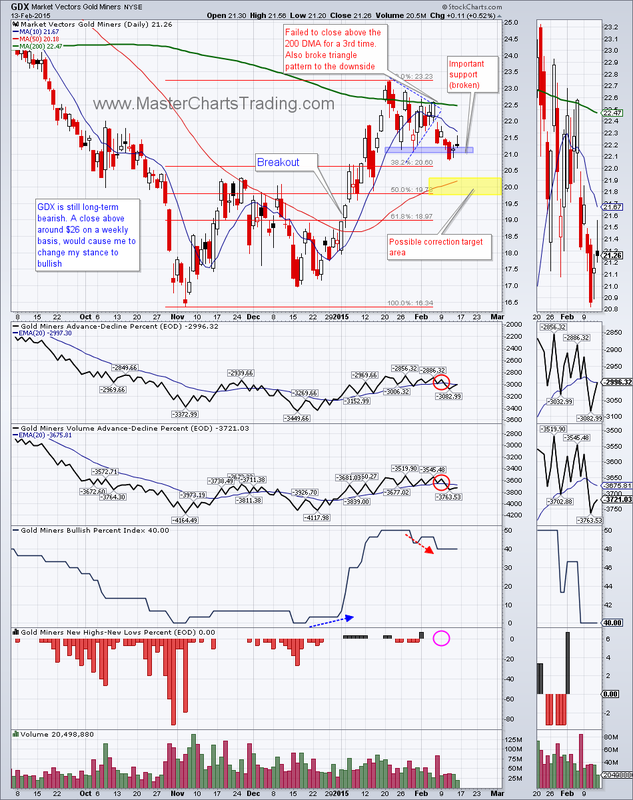
Gold miners, unsurprisingly, came under selling pressure as well. We were able to open a short position on February 6th as well. Since then, GDX broke an important support by closing below $21. I am targeting a correction to the $19.75-20.25 area (at least). 
Picture
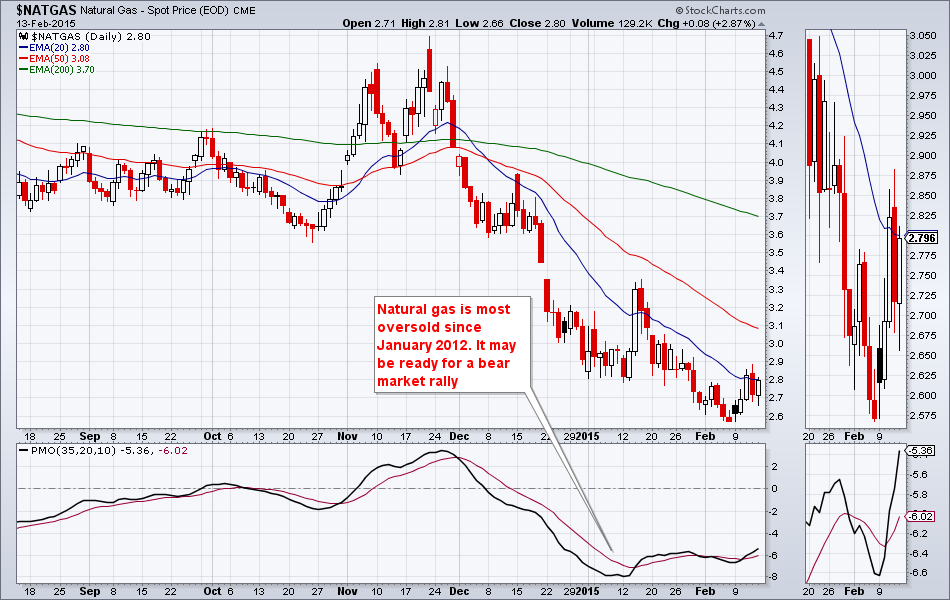
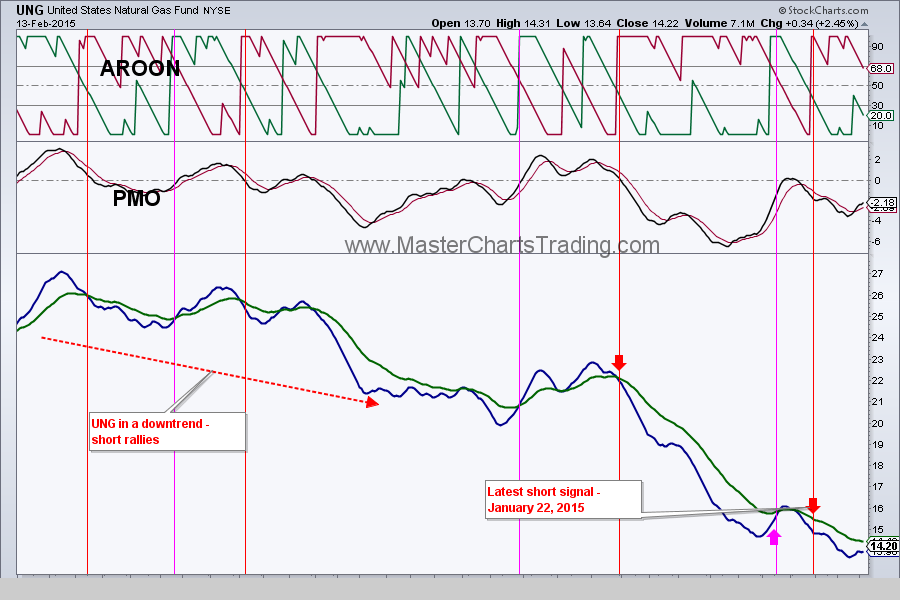
Finally, let us revisit natural gas – an oversold commodity. I highlighted$NATGAS a few weeks ago and wanted to reiterate that this is an extremely volatile security, so trading it carries an increased risk. Having said that, I think we may see at least a significant oversold bounce, or possibly a sustained rebound. Look on this chart for a buy signal. 

Picture
Picture
That’s it for this week’s recap,


Best Regards and have another great trading week!


Alexander Berger (www.MasterChartsTrading.com)

Disclaimer, we have:

Open positions: SPY, DUST

New position:

Closed position: 

Ready to trade? Sign-up Today
0 Comments


Leave a Reply.

    Picture
    Picture
    Subscribe to our mailing list!
    Picture
    Picture

    Archives

    November 2023
    October 2023
    September 2023
    August 2023
    July 2023
    June 2023
    May 2023
    April 2023
    March 2023
    February 2023
    January 2023
    December 2022
    November 2022
    October 2022
    September 2022
    August 2022
    July 2022
    June 2022
    May 2022
    April 2022
    March 2022
    February 2022
    January 2022
    December 2021
    November 2021
    October 2021
    September 2021
    August 2021
    July 2021
    June 2021
    May 2021
    April 2021
    March 2021
    February 2021
    January 2021
    December 2020
    November 2020
    October 2020
    September 2020
    August 2020
    July 2020
    June 2020
    May 2020
    April 2020
    March 2020
    February 2020
    January 2020
    December 2019
    November 2019
    October 2019
    September 2019
    August 2019
    July 2019
    June 2019
    May 2019
    April 2019
    March 2019
    February 2019
    January 2019
    December 2018
    November 2018
    October 2018
    September 2018
    August 2018
    July 2018
    June 2018
    May 2018
    April 2018
    March 2018
    February 2018
    January 2018
    December 2017
    November 2017
    October 2017
    September 2017
    August 2017
    July 2017
    June 2017
    May 2017
    April 2017
    March 2017
    February 2017
    January 2017
    December 2016
    November 2016
    October 2016
    September 2016
    August 2016
    July 2016
    June 2016
    May 2016
    April 2016
    March 2016
    February 2016
    January 2016
    December 2015
    November 2015
    October 2015
    September 2015
    August 2015
    July 2015
    June 2015
    May 2015
    April 2015
    March 2015
    February 2015
    January 2015
    December 2014
    November 2014
    October 2014
    September 2014
    August 2014
    June 2014
    May 2014
    April 2014
    March 2014
    February 2014
    January 2014

    RSS Feed

  All information on MasterChartsTrading.com is for educational and entertainment purposes only, and should not be construed as a recommendation to buy, sell or sell-short said securities. Read full disclaimer.