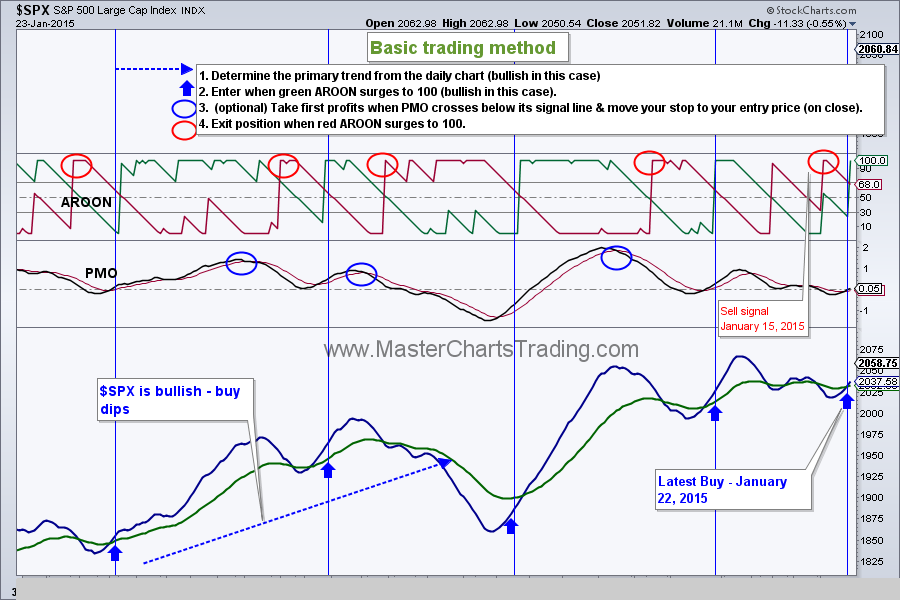
| | Friday, January 23, 2015 Weekly Market Recap. Watch video of this material here. The markets continue with its choppiness. Additionally, we are smack in the middle of the earnings season, which ads to not subtract from choppiness. Nevertheless, we got our buy signal on the S&P 500 on Thursday, January 22 and re-entered the market on the long side. New all-time highs seem likely now. |
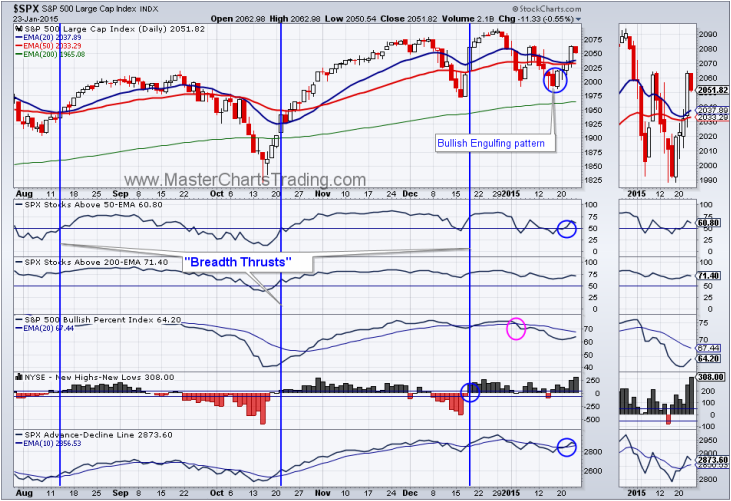
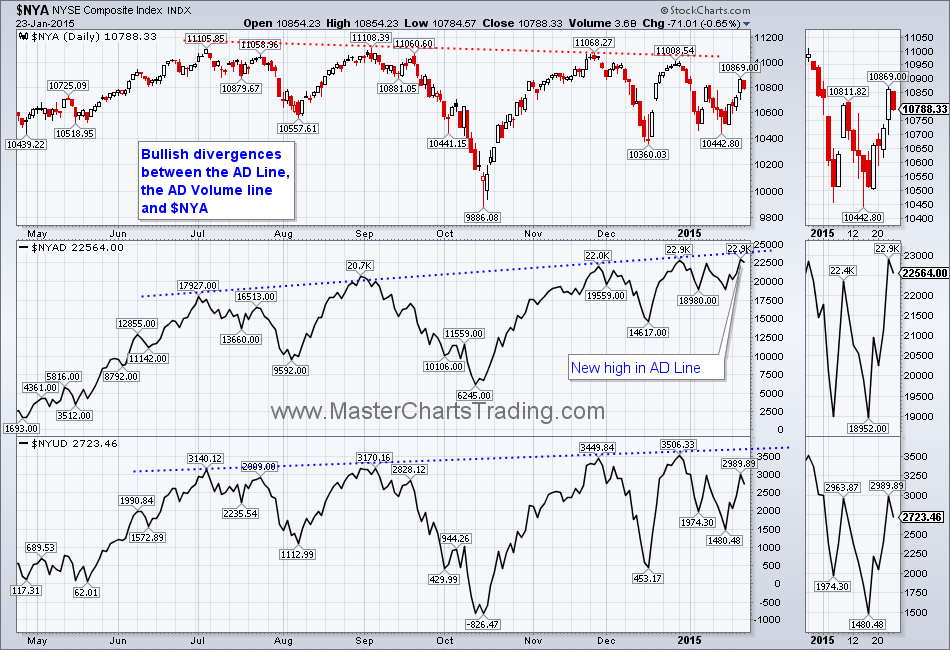
Market breadth for the S&P 500 is looking bullish. A long-term bullish divergence is also present between the $NYSE composite and its AD Line and the AD Volume lines. So unless we get another shock to the system, this furthers the case for new highs.
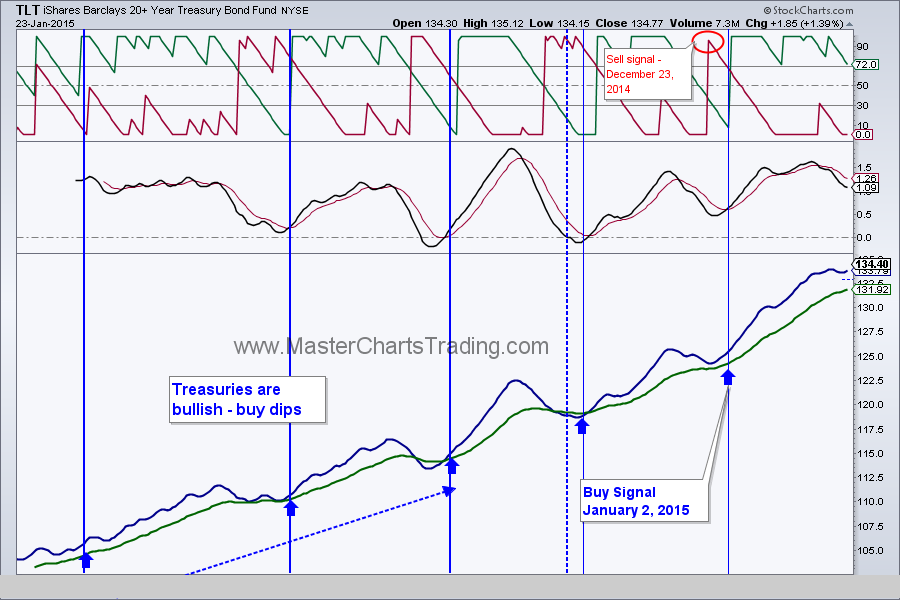
I may sound like a broken record, but bonds in the form of TLT (US long-dated Treasuries) hit yet another all-time high this week. TLT ended the week on a strong note, but is very overbought. I am expecting a pullback to at the $129 area - at least - especially if the stock market pushes higher. We took some profits in TLT and closed our position in AGG to lock in our gains.
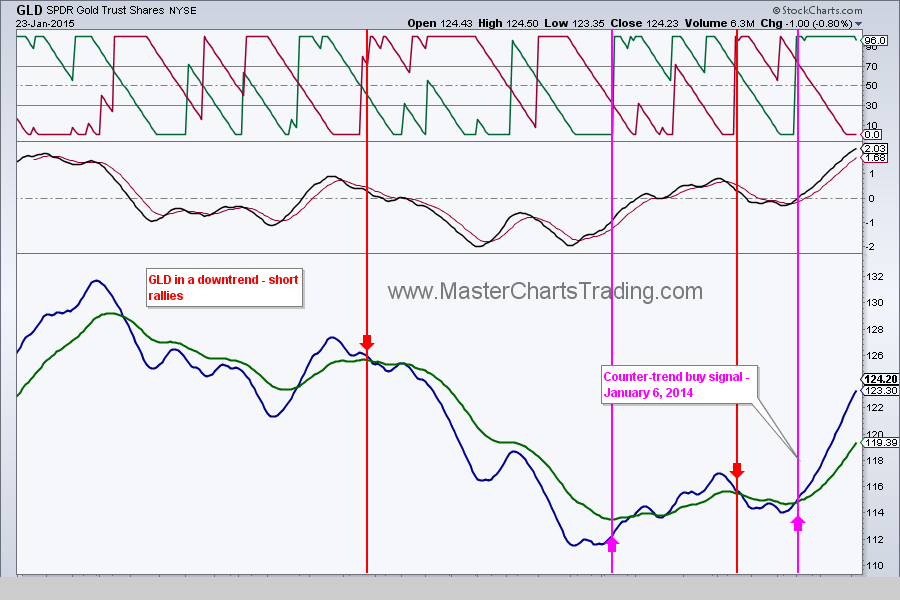
Gold benefited from all the currency manipulations going on in the world, be that of a the Swiss, the Japanese, or of the European Central Banks. As I mentioned before, gold is still in a long-term bear market, so this latest bounce from January 6th is still a bear market rally in my view.
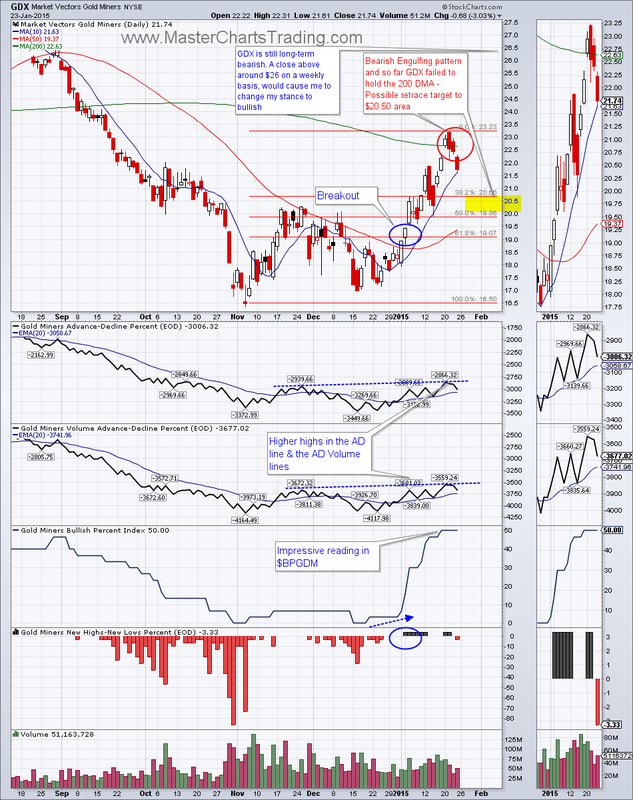
Selling pressure is already creeping into the gold market. It is evident in the behavior of thegold miners ETF – GDX. GDX was up as much as 15% from our entry point on January 6. Yet today it closed over 6% down from its high point that happened on January 21st. Furthermore, GDX printed a Bearish Engulfing pattern on January 20 and 21st and confirmed this pattern on the next day. I am expecting a retrace to around $20-20.50 area, at least. We closed most of our GDX position.
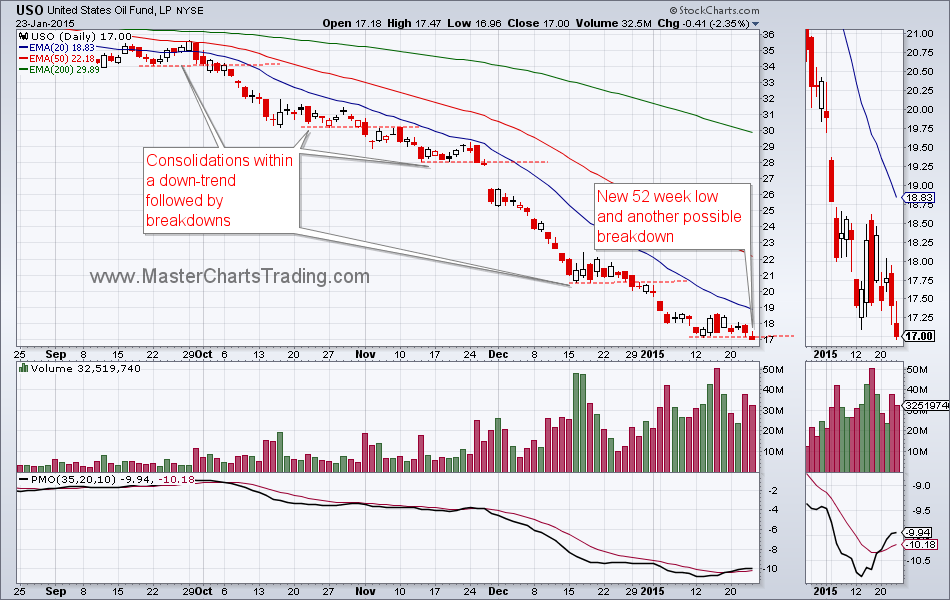
Oil wants to go lower. An important test of the January 13th low may be just around the corner. For now there seems to be good support around $44-46 area. Should that give, we could see oil reach high $30th. By extension, USO hit yet another 52 week low.
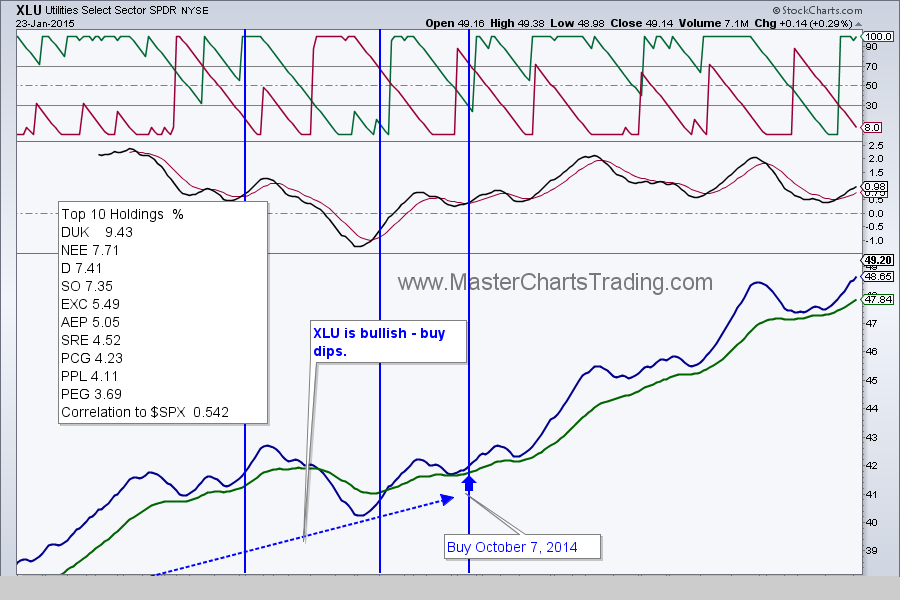
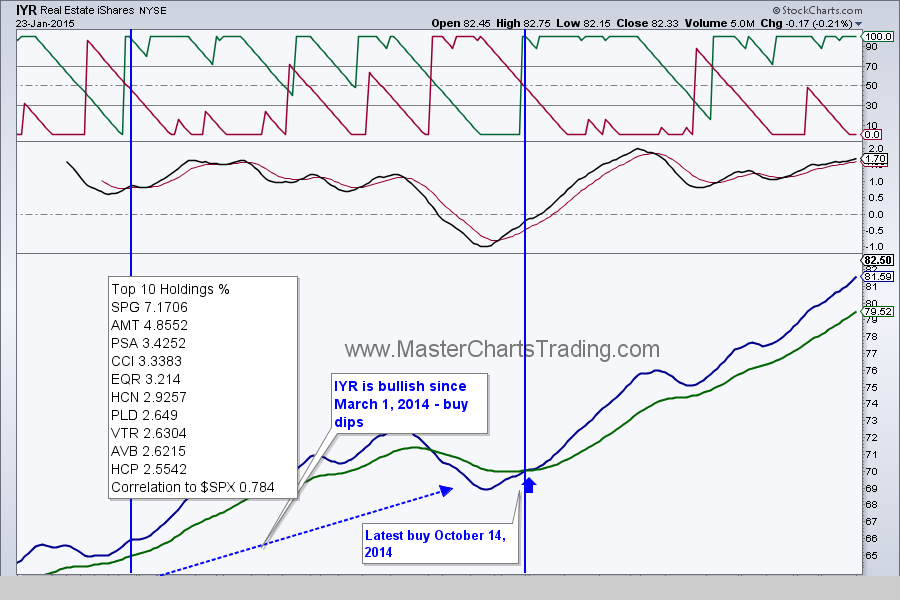
Defensive sectors have been the recipients of inflows of money in the past few months,Utilities and Real Estate, to name a few. From our entry points in October of last year, Utilities Fund (XLU) is up over 15%, while the Real Estate fund (IYR) is up over 17%. This indicates that money may be assuming a more defensive posture.
That’s it for this week’s recap,
Best Regards and have another great trading week!
Alexander Berger (www.MasterChartsTrading.com)
Disclaimer: we have open positions in: SPY, TLT (took profits), GLD (took profits), GDX (took profits)
Closed position: AGG
Best Regards and have another great trading week!
Alexander Berger (www.MasterChartsTrading.com)
Disclaimer: we have open positions in: SPY, TLT (took profits), GLD (took profits), GDX (took profits)
Closed position: AGG


 RSS Feed