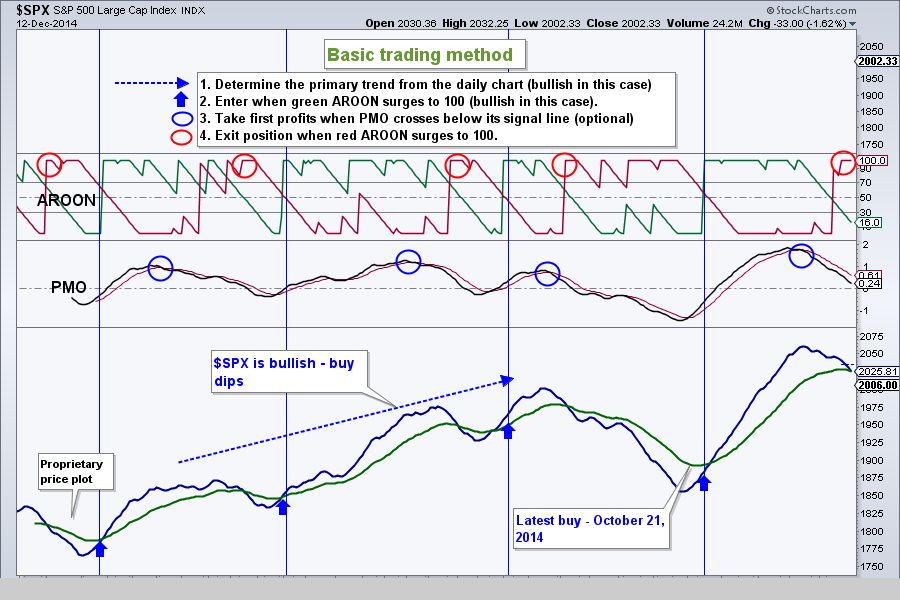
All this week the S&P 500 did pretty much nothing else but go down. When all was said and done it was down over 3.5%. Not an insignificant amount! Our trading system warned us to take profits and finally on Friday, we closed our open position in the large caps. We now have no long exposure to stocks. The S&P 500 is long-term bullish though, so at this point I am simply viewing this as a pullback within a bigger uptrend.
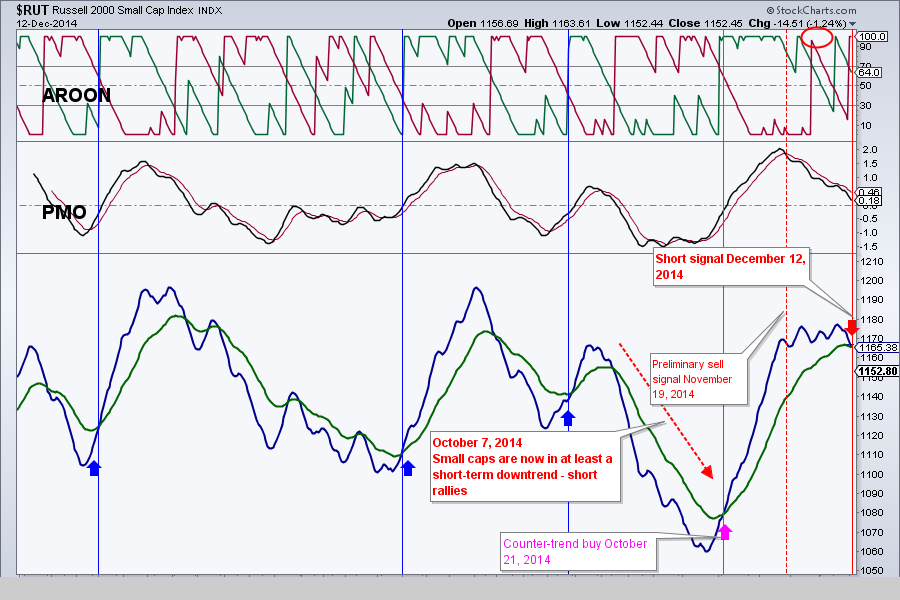
The Russell 2000 is a different story. I maintained my bearish view of the Russell since October 7. Now on Friday our system gave us a sell signal. This is not just a sell signal, rather a short signal – since we are trading in the direction of a primary trend. We are playing this potential drop in the small caps by buying an inverse fund called TZA.
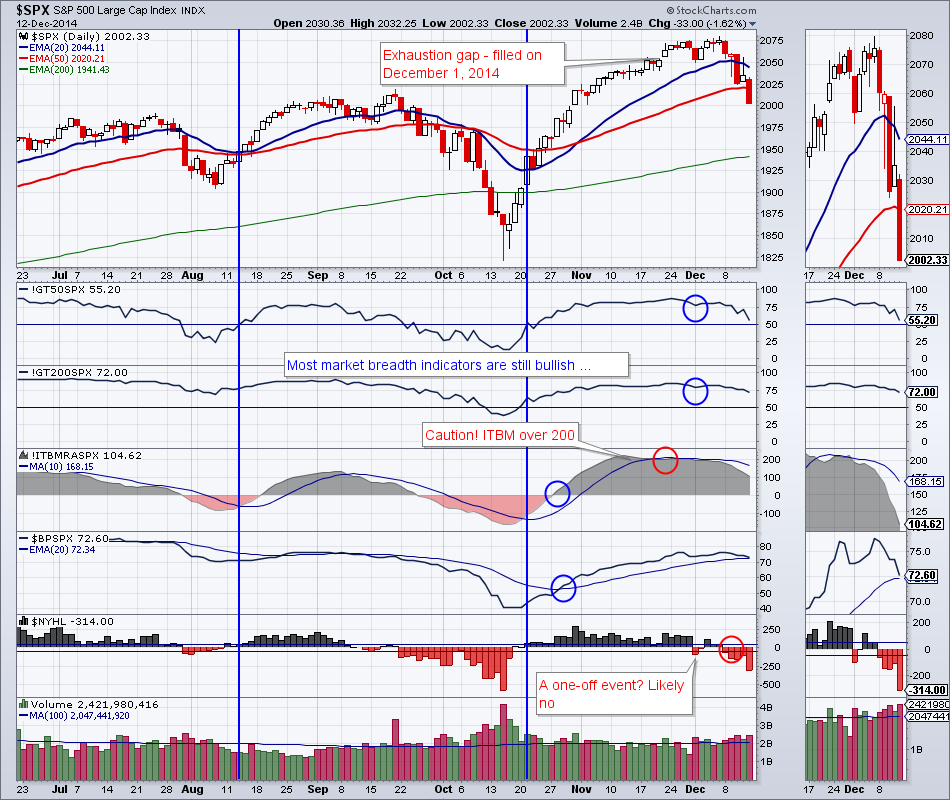
Market breadth deteriorated further and significantly. NYSE Net New Highs indicator ($NYHL) has been negative for the past 5 trading sessions. In the past this presaged a market decline/correction. Other breadth indicators are still bullish. Remember that this advance from October 15 was extremely steep, so market breadth may be “overbought” still.
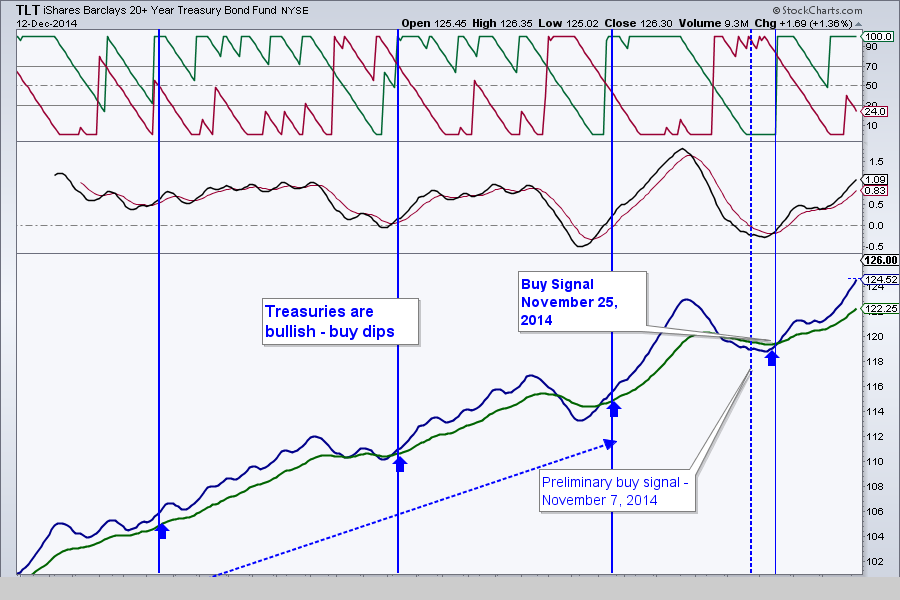
Bonds are gaining nicely as scared money is rotating out of stocks. We scaled into TLT starting as early as November 7th and were fully invested on November 25th. We still have a majority of the position open in TLT. TLT closed at an all-time closing high (not an all-time high) on Friday, December 12.
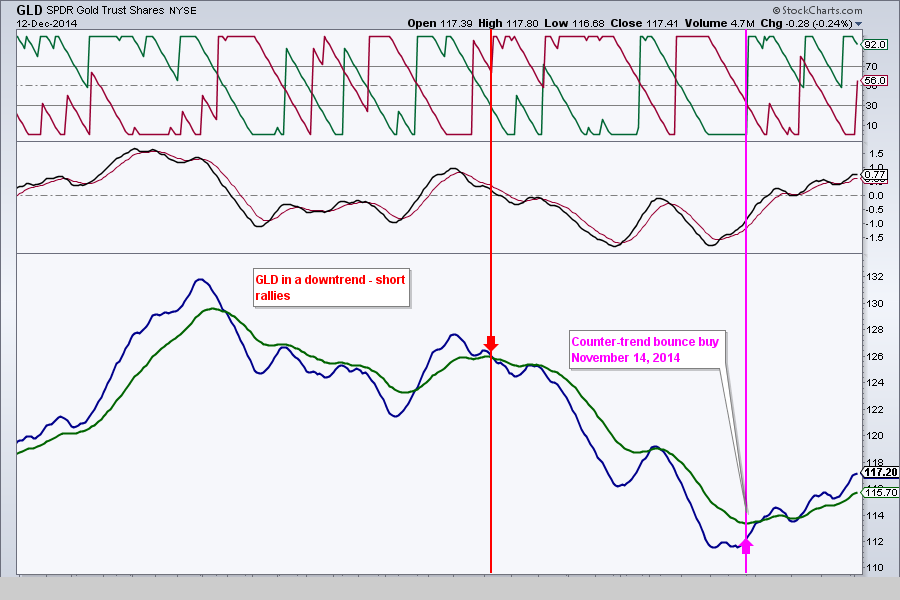
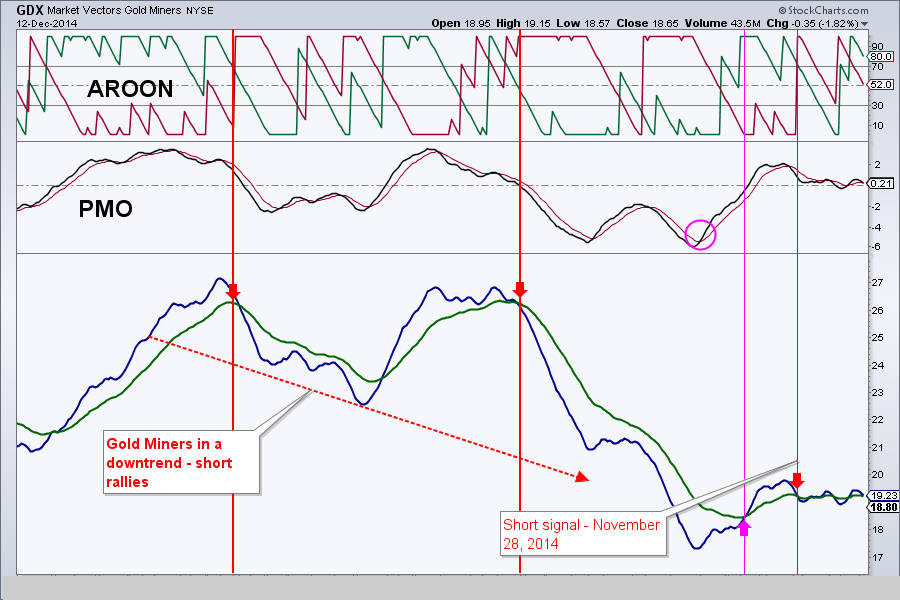
Gold has been very indecisive. It is up a little under 3% since our buy signal on November 14. Conversely, the gold miners also had a buy signal on November 14, but reversed with a gap down and gave a short signal on November 28. Since then its been chopping around, but basically flat. My bias is bearish because it is long-term bearish, however, a decisive close above $20.42, or a decisive close below $18.09 would seal the short-term fate of GDX.
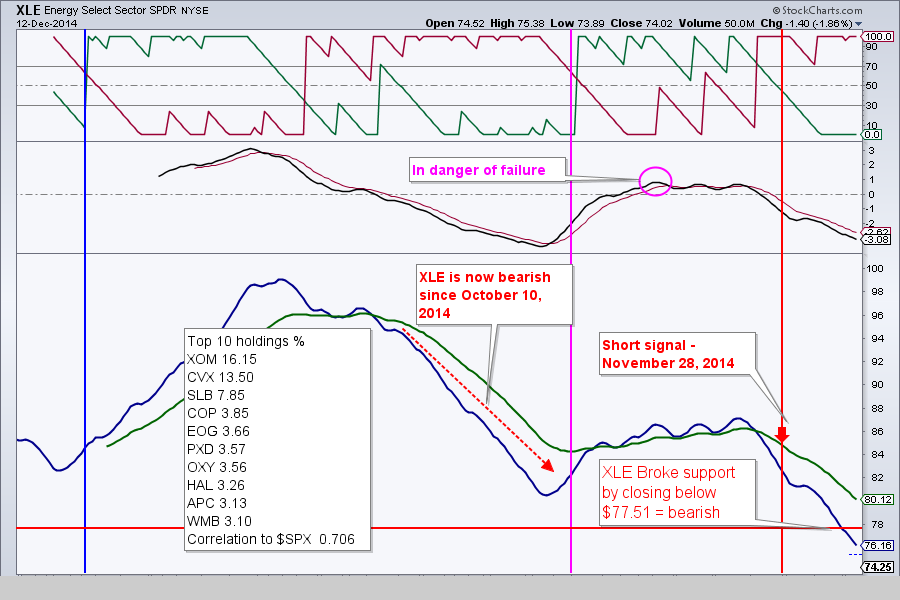
Energy prices continue down, but are extremely oversold (USO is down over 12% this week alone, on huge volume). A bounce is likely. We have an open position in ERY (inverse of XLE), which is gaining nicely since our entry on November 28.
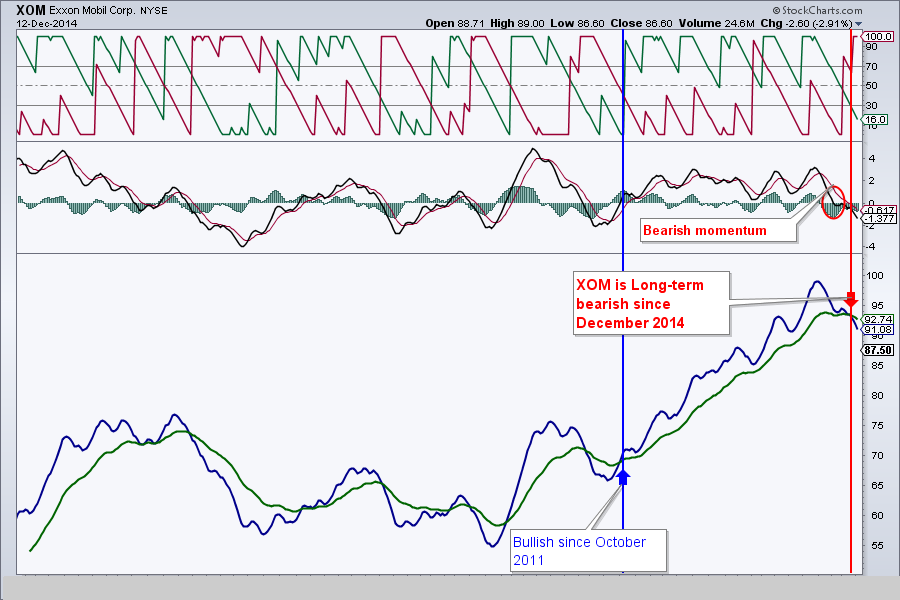
To highlight a stock I follow on my public charts that has been hit hard by the resent oil rout, I choose Exxon Mobile (XOM). XOM hit a 52 week low on Friday, and according to my charts, has now officially entered the bear market. Rebounds should now be viewed as an opportunity to short.
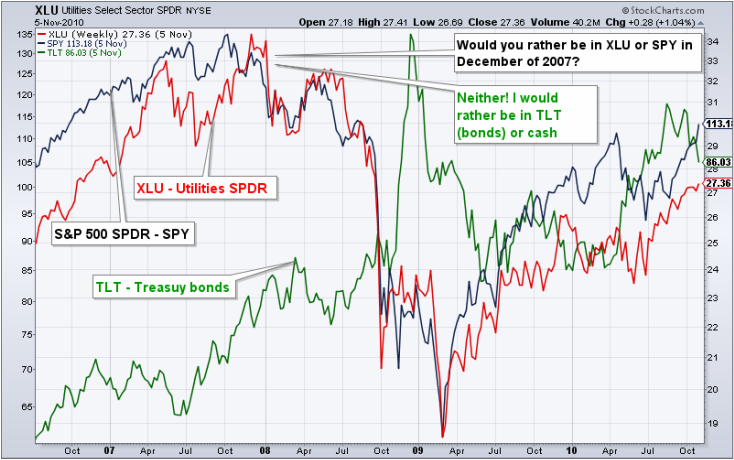
I am seeing a general tendency of a flight to safety in the markets. Be that strength in the bond markets, increased pressure on riskier assets (small caps), or strength in utilities.
Select sector Utilities SPDR fund (XLU), together with Real Estate (REITs) fund (IYR) suffered the least selling on Friday. They were both down a little over 0.9%. Utilities and REITs both benefit from the lower rates provided by the rising bond prices.
An important caveat is that they are still STOCKS. And stocks have high degree of correlation to the general markets (some exceptions exist). In the case of XLU and IYR, both of these funds positively correlate to the S&P 500. Should there be significant selling in the major indices, XLU and IYR will undoubtedly follow in time.
That’s it for this week’s recap!
Best Regards and have another great trading week!
Alexander Berger (www.MasterChartsTrading.com)
Disclaimer: we have open positions in: TLT (took profits), DUST, ERY
Closed position: SPY
New position: TZA
Best Regards and have another great trading week!
Alexander Berger (www.MasterChartsTrading.com)
Disclaimer: we have open positions in: TLT (took profits), DUST, ERY
Closed position: SPY
New position: TZA


 RSS Feed