Friday, December 19, 2014 Weekly Market Recap.
Watch video here
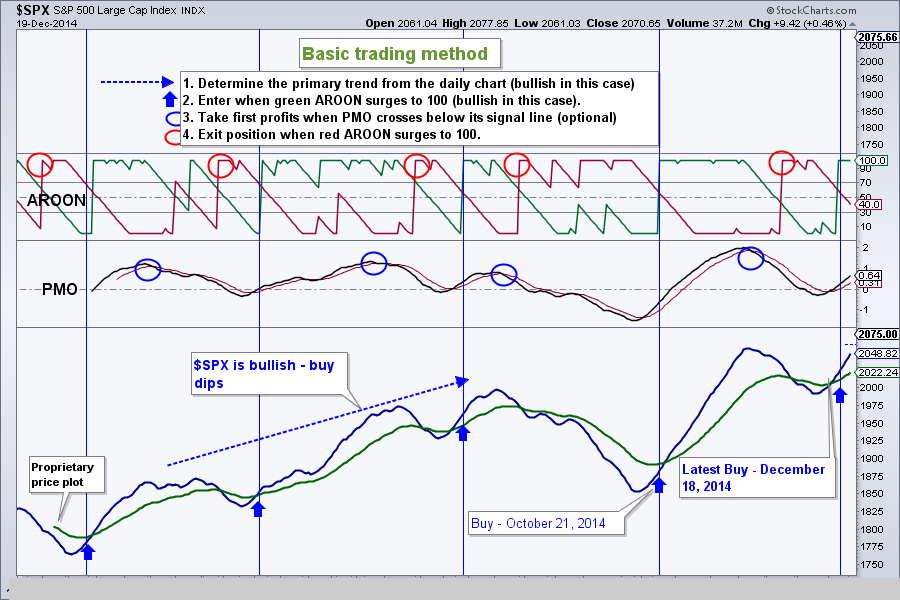
Following a sharp decline, the markets rebounded just as sharply over the past 3 trading days. On the previous upswing from late October, our charts warned us to start taking profits as early as previous Wednesday and we closed our position in SPY Friday before last on December 12th.
However this Wednesday, December 17th the S&P 500 reversed very sharply and followed through next 2 days to close near all-time highs. We re-entered the market on December 18th.
Watch video here
Following a sharp decline, the markets rebounded just as sharply over the past 3 trading days. On the previous upswing from late October, our charts warned us to start taking profits as early as previous Wednesday and we closed our position in SPY Friday before last on December 12th.
However this Wednesday, December 17th the S&P 500 reversed very sharply and followed through next 2 days to close near all-time highs. We re-entered the market on December 18th.
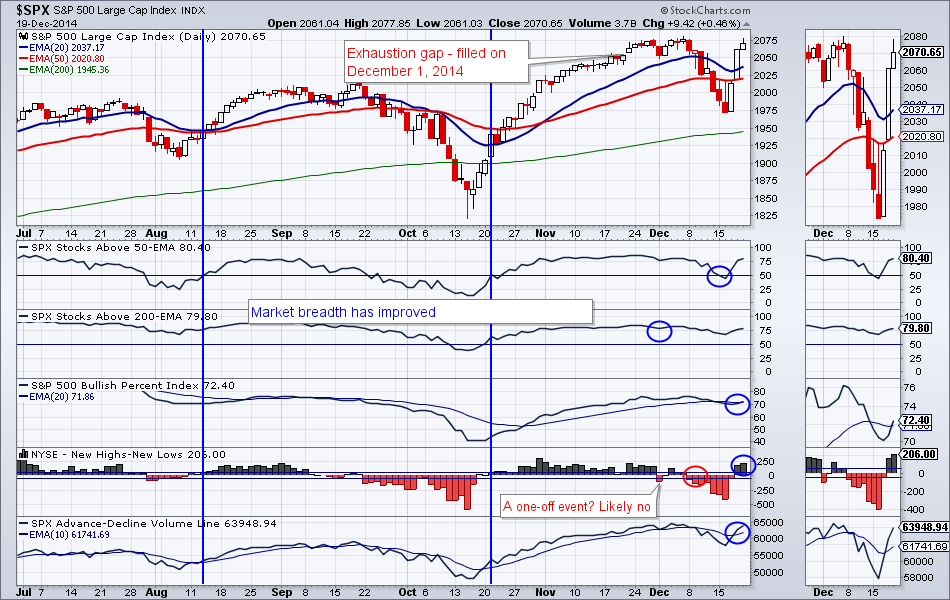
Market breadth improved dramatically from last week. All market breadth indicators are now bullish. Unless some black swan event takes place, I expect new all-time highs to be in place very soon.
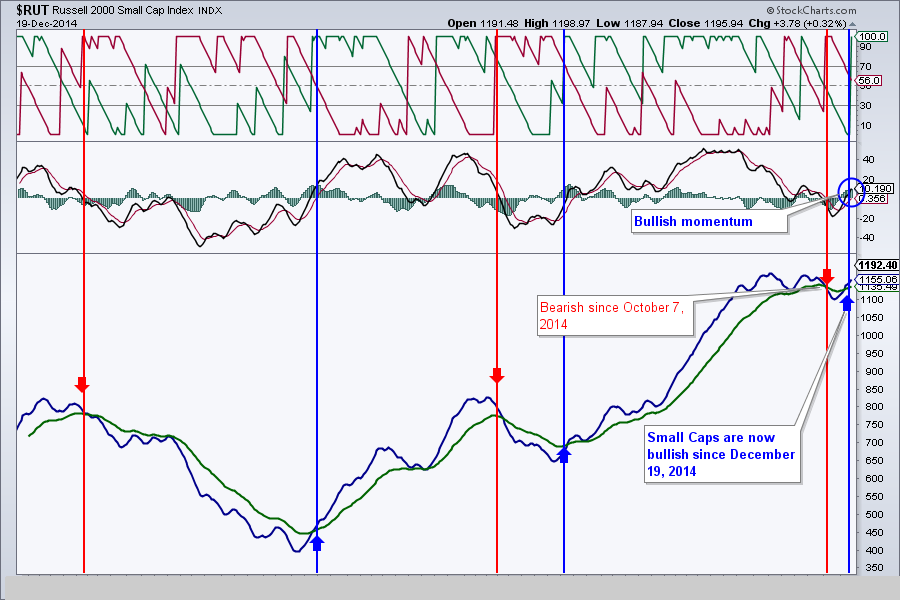
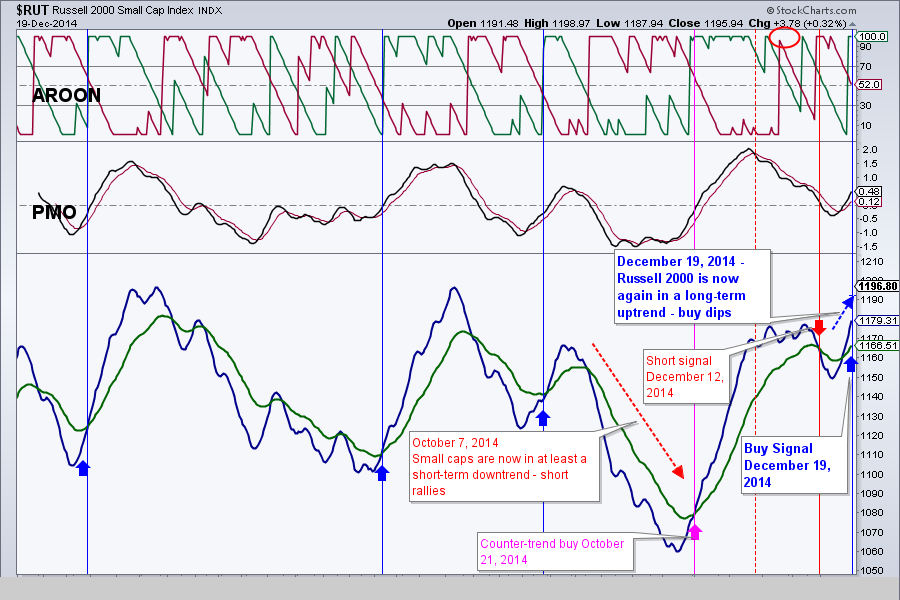
I had a short open on the Russell 2000 small cap index going into this week. Following the dramatic reversal this week, I covered the short for 2 reasons:
a. The short-term indicators told me to cover and more importantly
b. Long-term, the Russell has flipped into the bullish mode. The daily charts now shows that the double top I spoke about before, will likely be negated and I expect new highs as well in the Russell (barring unforeseen dramatic events)
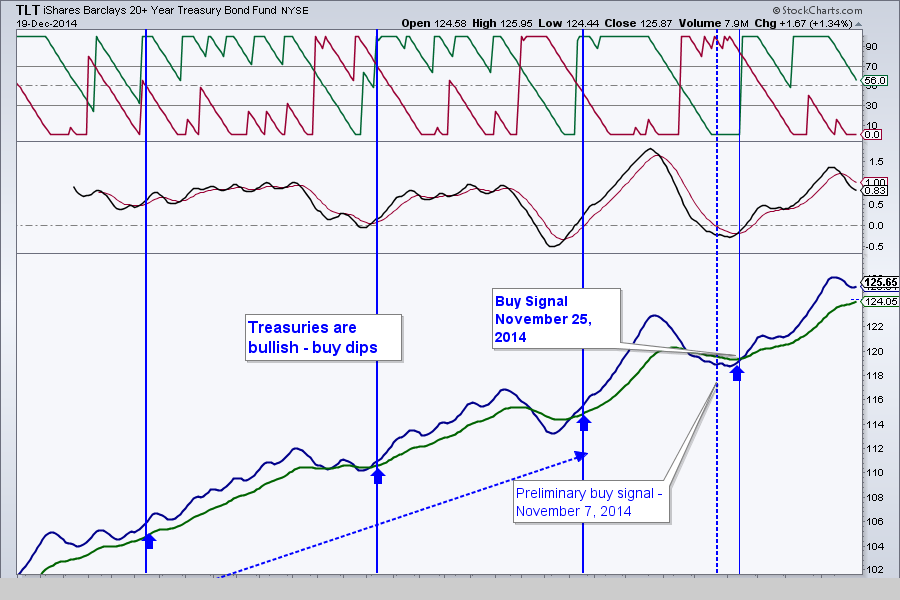
Bond markets reacted negatively to the FOMC minutes regarding interest rates. Long-term bonds (TLT) sold-off sharply from all-time highs. They however regained on Friday. This shows that a bull market in long bonds is not yet over. We took profits in out bond positions, but we still have about half of the position open.
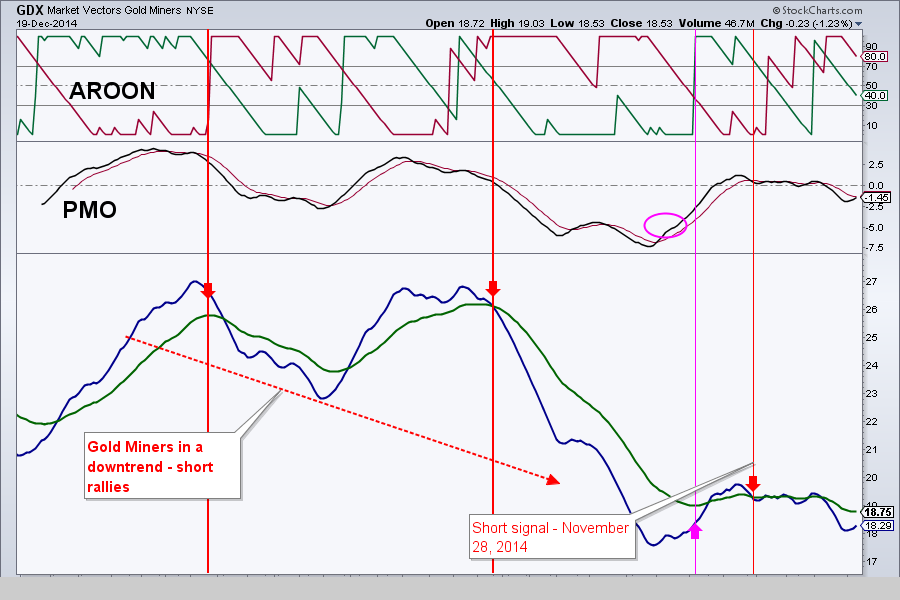
Gold miners again were indecisive. On Tuesday GDX was as lows as $17.08, but by then end of the week GDX rallied back up and closed slightly down for the week. My bias is still bearish. Ideally GDX should close below $18 on weekly basis, otherwise a rally to resistance at around $20 is possible.
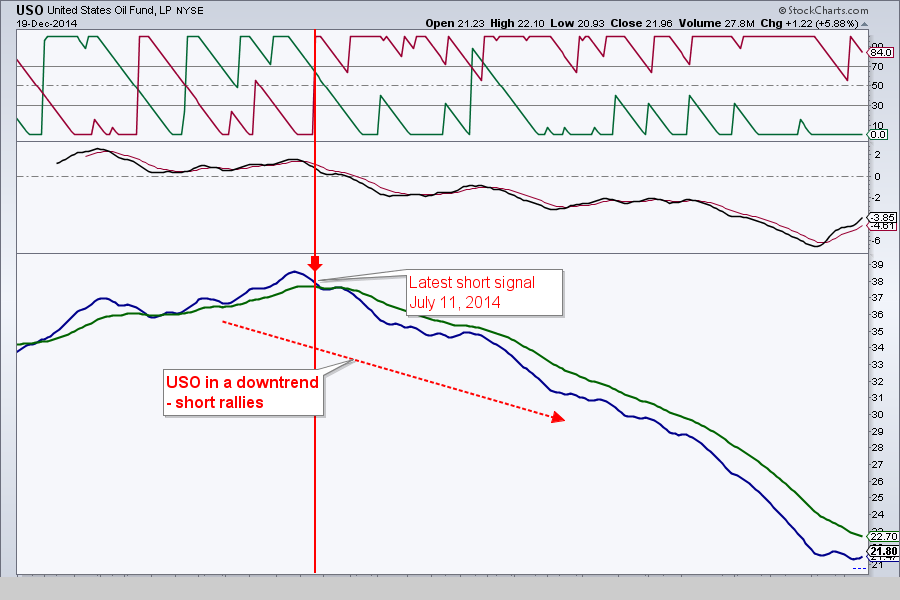
Oil seems to have stopped falling, and with it, the oil related assets and countries rallied hard (RSX is up almost 30% over the last 4 sessions). My charts are still showing oil in a downtrend with not even a counter-trend buy signal.
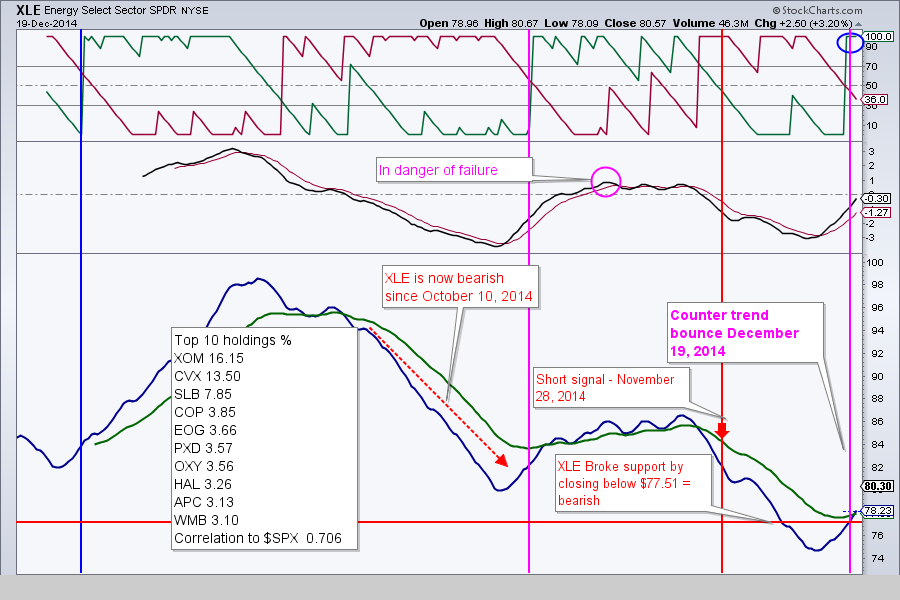
Counter-trend bounce in XLE started on Friday and we closed our short position in XLE (ERY) with a gain. At this point of the game, I consider energy related shares still in a downtrend, so I would prefer to short the future rallies.
That’s it for this week’s recap,
Best Regards and have another great trading week!
Alexander Berger (www.MasterChartsTrading.com)
Disclaimer: we have open positions in: TLT (took profits), DUST
New position: SPY
Closed position: TZA, ERY
Best Regards and have another great trading week!
Alexander Berger (www.MasterChartsTrading.com)
Disclaimer: we have open positions in: TLT (took profits), DUST
New position: SPY
Closed position: TZA, ERY


 RSS Feed