Master Charts Trading - Stock Market Indicators & Trade Alerts
Connect To Us!
  • MasterChartsTrading
  • Blog
  • Sign-Up
  • Members
    • Elite Trading Blog
    • Stock Speculator Blog
    • Training Library >
      • Basics of Trading
      • Risk & Trading Psych
      • Trend Identification
  • Help
    • Hall of Fame
    • Social
    • About Us
    • Contact
    • FAQs
    • Disclaimer
    • Refund Policy
    • Privacy Policy
    • What We Trade
    • Newsletter samples

video Market recap for the week ending friday december 5, 2014

12/5/2014

0 Comments

 
Friday, December 5, 2014 Weekly Market Recap. Watch Video Here

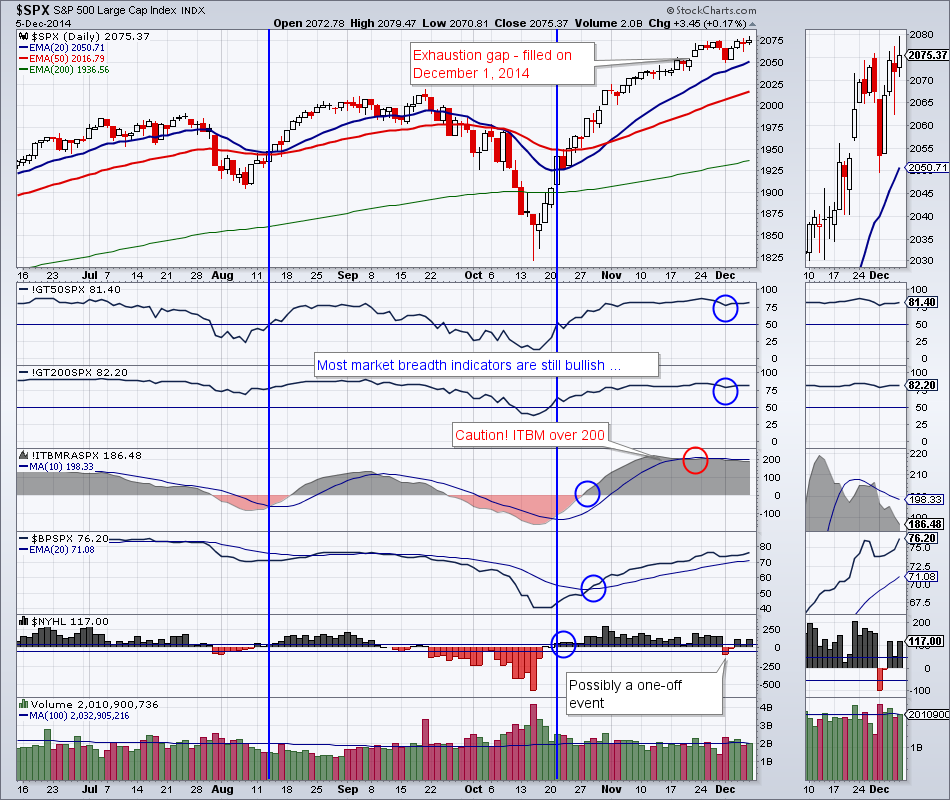
         Large Cap stocks  truly have gone nowhere in the past 2 weeks. The S&P 500 is stuck in a tight 25 point trading range between 2050 and 2075. At this point, no sell signal was given by our trading system and we still have a position in SPY open.

Picture
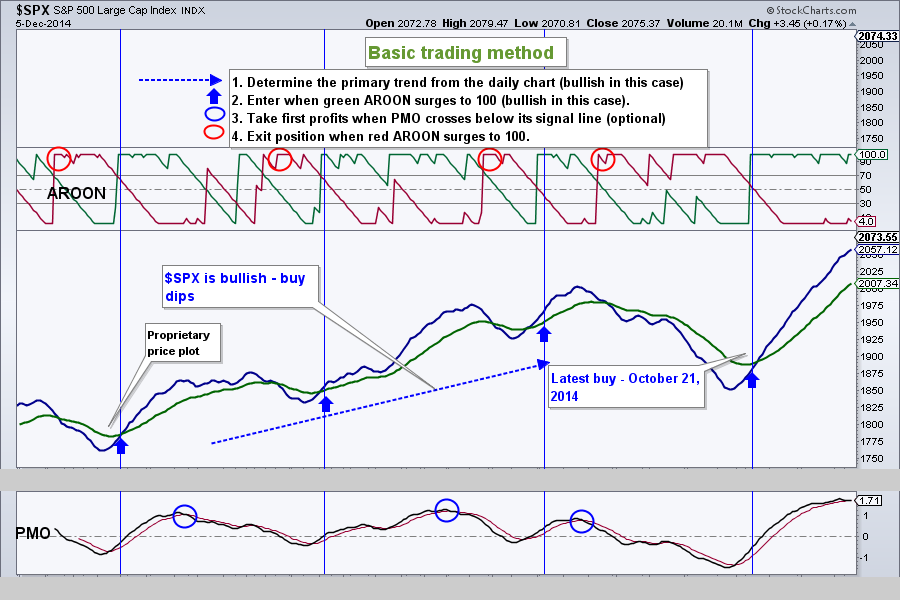
Market breadth for the large caps is mostly bullish. Bears have a lot of work cut out for them to turn this ship around.         

Picture
The Russell 2000 appeared to break support on December 1, but rallied back up. I am now waiting for AROON Red on this chart to make another high to short the Russell 2000. This may or may not happen, Russell might make new highs and turn bullish once again.
Picture
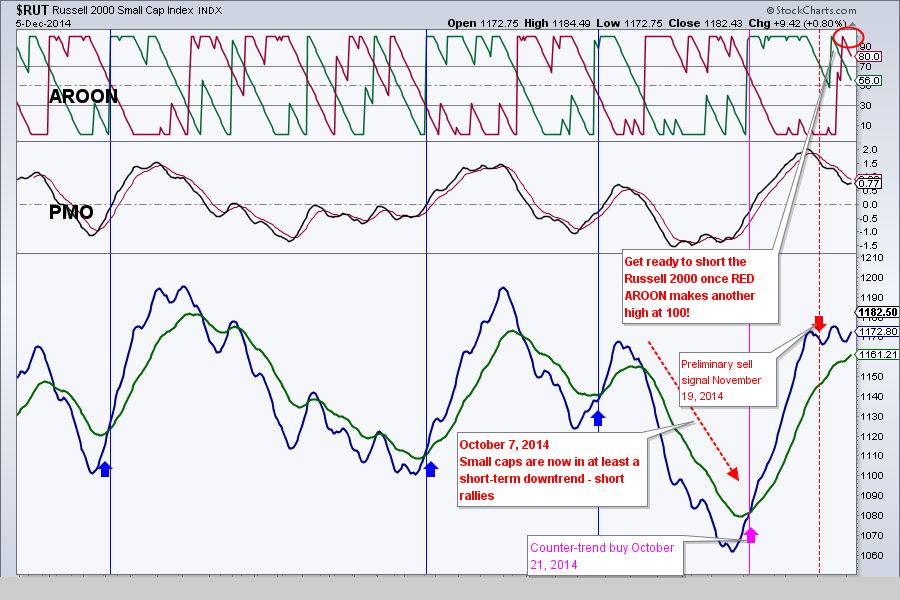
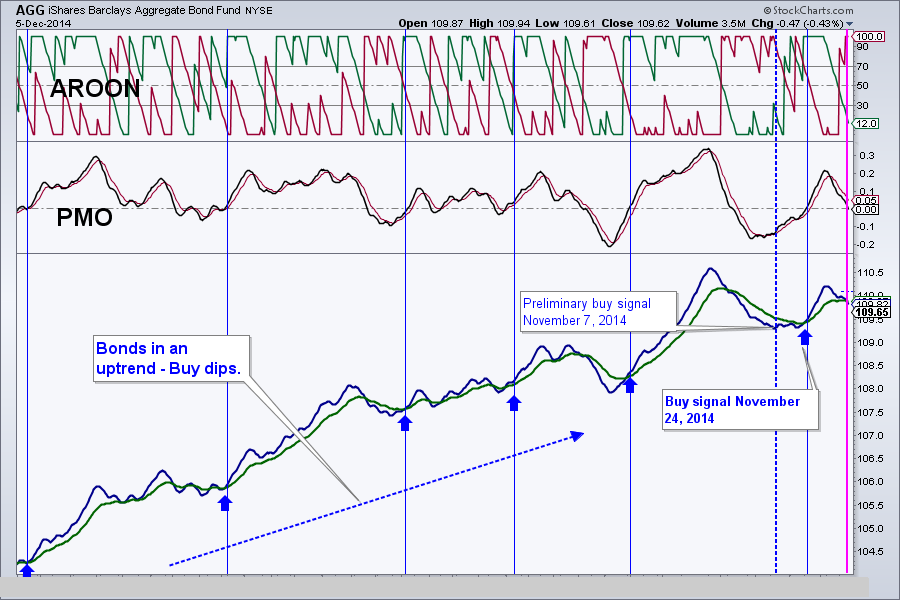
The reason Russell might make new highs and not roll over is yields. Bonds came under selling pressure this week as a result we pared our holdings in bonds and Treasuries.
Picture
Picture
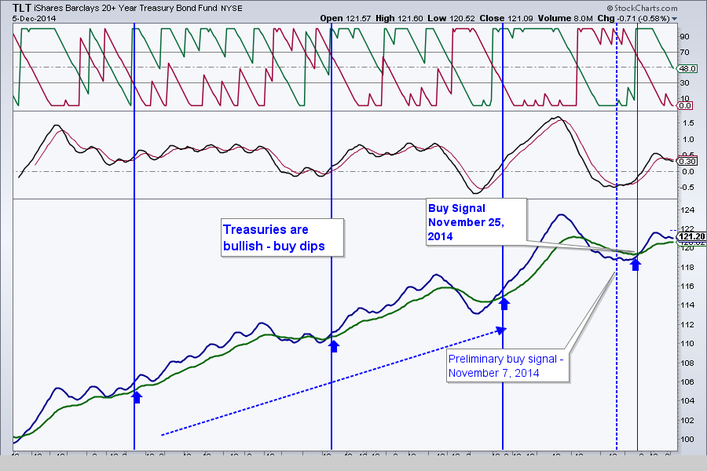
Because of bonds loosing ground, regional banks have rallied hard and likely broke to the upside. (Regional banks make money by borrowing at short-term rates and lending at long-term rates. If rates rise, regional banks have wider profit margins). If we look at the composition of the Russell 2000 index we see that it is composed of as much as 24% financials. Should bonds continue to drop, Russell 2000 will likely benefit.

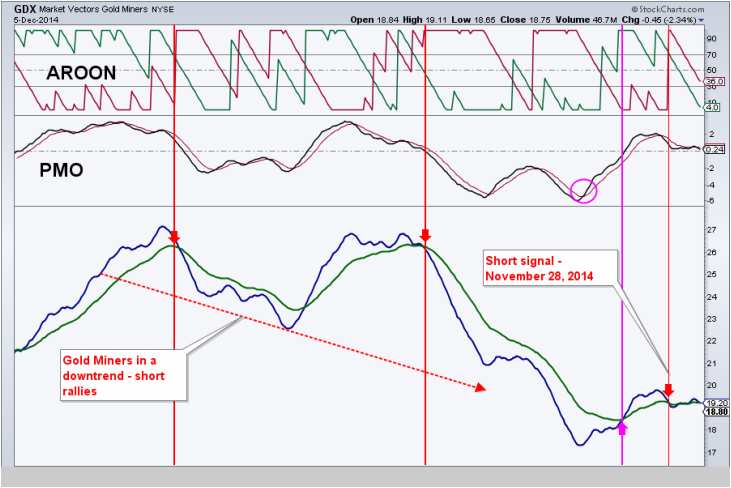
Gold miners are indecisive. We have an open position in DUST (inverse gold miners), but GDX has been stuck in a trading range. A break below $18.40 would open the door to a retest of lows at around $16.60.    


Picture
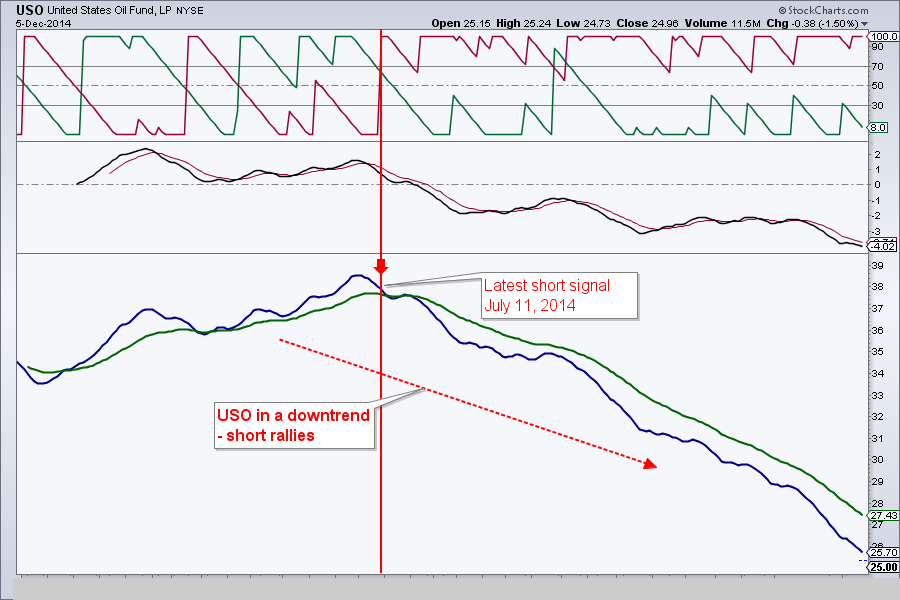
Energy prices continue to slide with no end in sight. USO lost over 4% this week.    
Picture
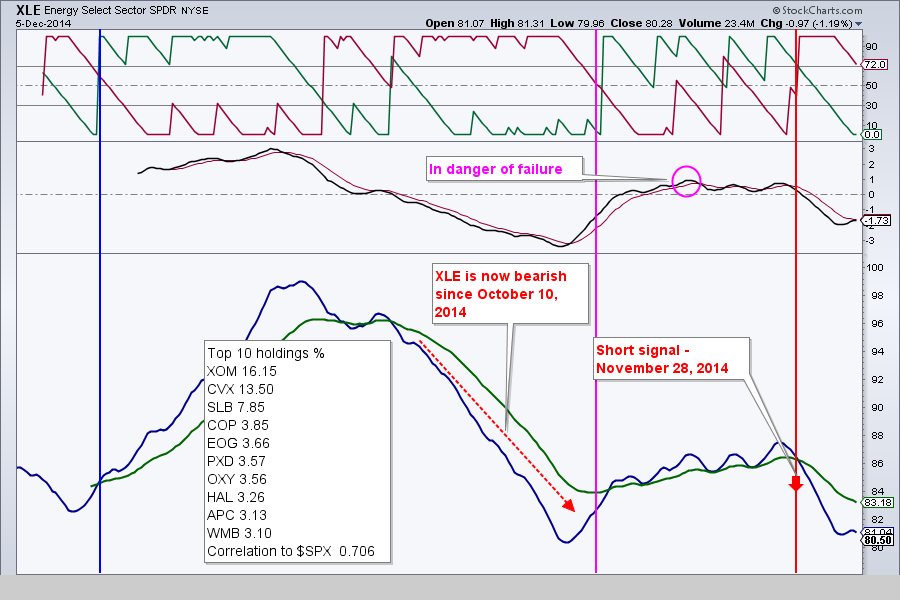
XLE is down a few percentage points. Should XLE break support at $78.50 we may see a significant acceleration of XLE price to the downside
Picture
That’s it for this week’s recap!

Best Regards and have another great trading week!

 
Alexander Berger (www.MasterChartsTrading.com)
 Disclaimer: we have open positions in SPY, TLT (took profits), DUST, ERY
Closed positions: AGG

Ready to trade? Sign-up Today
0 Comments


Leave a Reply.

    Picture
    Picture

    Subscribe to our mailing list!

    * indicates required
    /* real people should not fill this in and expect good things - do not remove this or risk form bot signups */

    Intuit Mailchimp

    Click to set custom HTML
    Picture
    Picture

    Archives

    January 2025
    December 2024
    November 2024
    October 2024
    September 2024
    August 2024
    July 2024
    June 2024
    May 2024
    April 2024
    March 2024
    February 2024
    January 2024
    December 2023
    November 2023
    October 2023
    September 2023
    August 2023
    July 2023
    June 2023
    May 2023
    April 2023
    March 2023
    February 2023
    January 2023
    December 2022
    November 2022
    October 2022
    September 2022
    August 2022
    July 2022
    June 2022
    May 2022
    April 2022
    March 2022
    February 2022
    January 2022
    December 2021
    November 2021
    October 2021
    September 2021
    August 2021
    July 2021
    June 2021
    May 2021
    April 2021
    March 2021
    February 2021
    January 2021
    December 2020
    November 2020
    October 2020
    September 2020
    August 2020
    July 2020
    June 2020
    May 2020
    April 2020
    March 2020
    February 2020
    January 2020
    December 2019
    November 2019
    October 2019
    September 2019
    August 2019
    July 2019
    June 2019
    May 2019
    April 2019
    March 2019
    February 2019
    January 2019
    December 2018
    November 2018
    October 2018
    September 2018
    August 2018
    July 2018
    June 2018
    May 2018
    April 2018
    March 2018
    February 2018
    January 2018
    December 2017
    November 2017
    October 2017
    September 2017
    August 2017
    July 2017
    June 2017
    May 2017
    April 2017
    March 2017
    February 2017
    January 2017
    December 2016
    November 2016
    October 2016
    September 2016
    August 2016
    July 2016
    June 2016
    May 2016
    April 2016
    March 2016
    February 2016
    January 2016
    December 2015
    November 2015
    October 2015
    September 2015
    August 2015
    July 2015
    June 2015
    May 2015
    April 2015
    March 2015
    February 2015
    January 2015
    December 2014
    November 2014
    October 2014
    September 2014
    August 2014
    June 2014
    May 2014
    April 2014
    March 2014
    February 2014
    January 2014

    RSS Feed

  All information on MasterChartsTrading.com is for educational and entertainment purposes only, and should not be construed as a recommendation to buy, sell or sell-short said securities. Read full disclaimer.