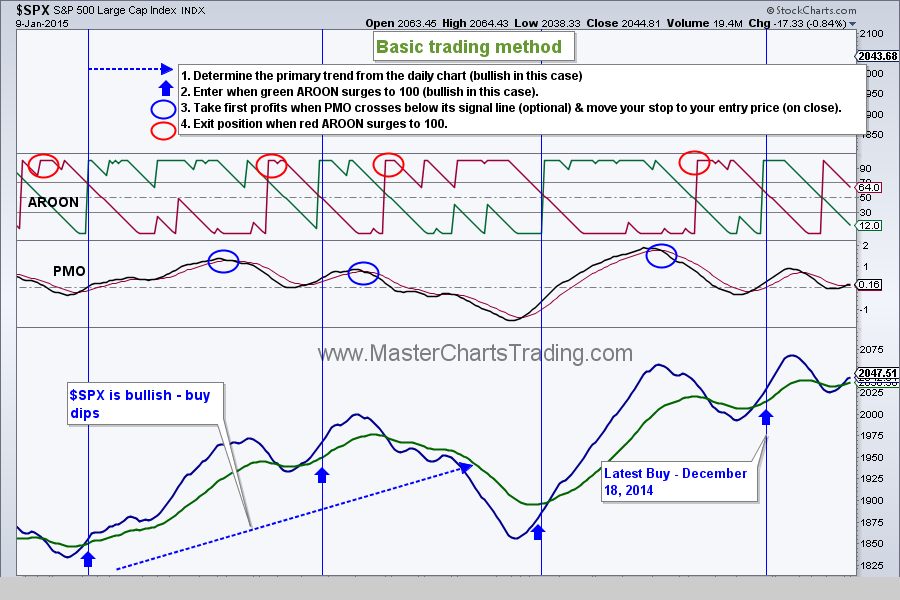
| Friday, January 9, 2015 Weekly Market Recap. Thelong-term picture for stocks remains the same – stock market in the USA is bullish. | |
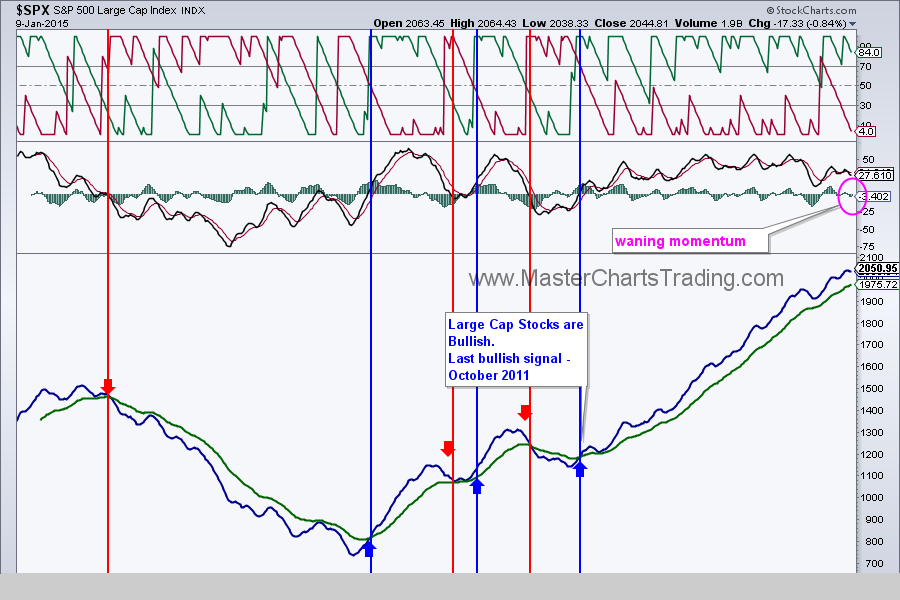
Short term, after hitting all-time highs, the markets turned somewhat volatile over the past few weeks. We are letting our position in SPY fluctuate a bit, but are watching for any support breaks.
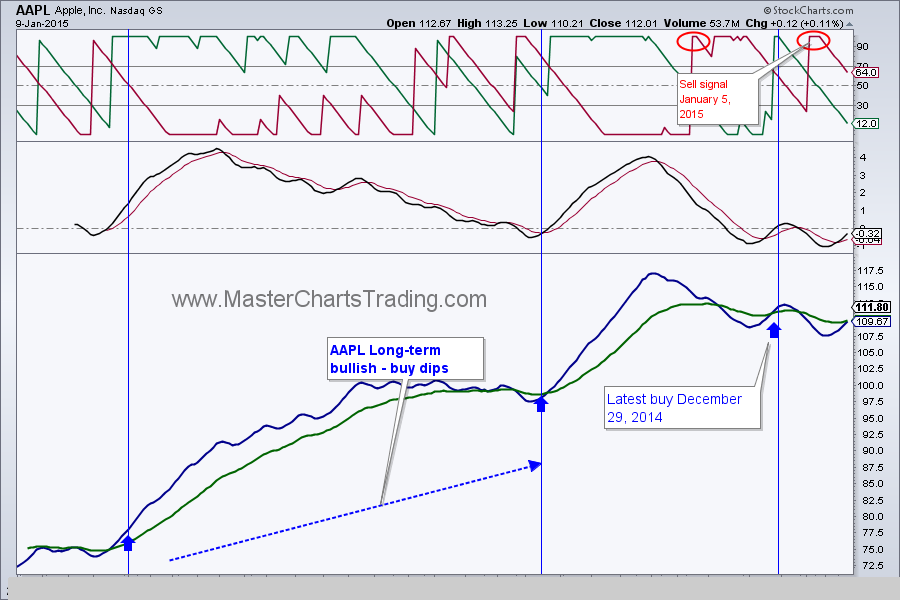
Technology (and biotechs) are the current market leaders, but Apple has been dragging its feet lately. Once Apple gets its act together, we may see new highs again in XLK.
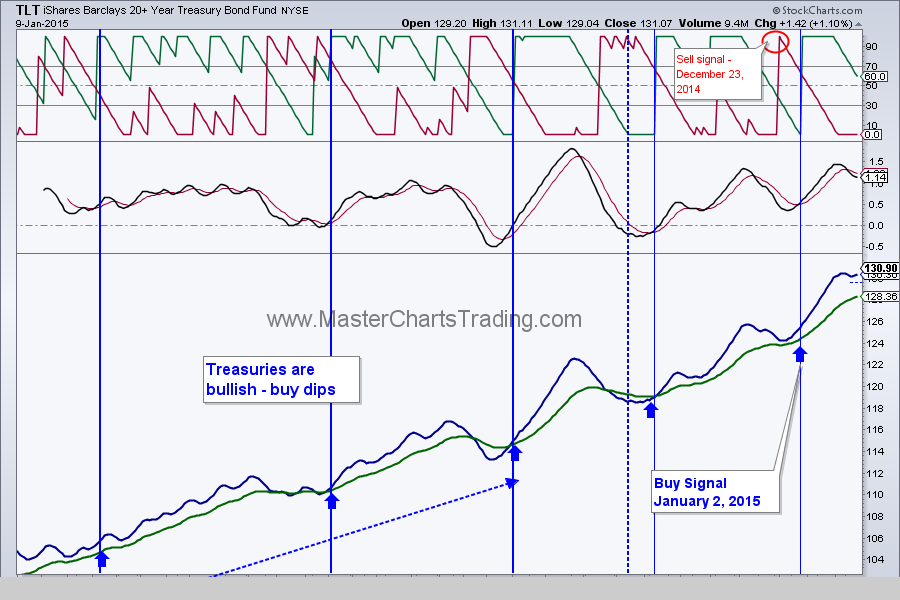
Whiffs of deflationary pressure in Europe, and the somewhat politically destabilizing effects of cheap oil are pushing scared money into the bond markets. Treasuries (TLT) hit yet another all time high this week.
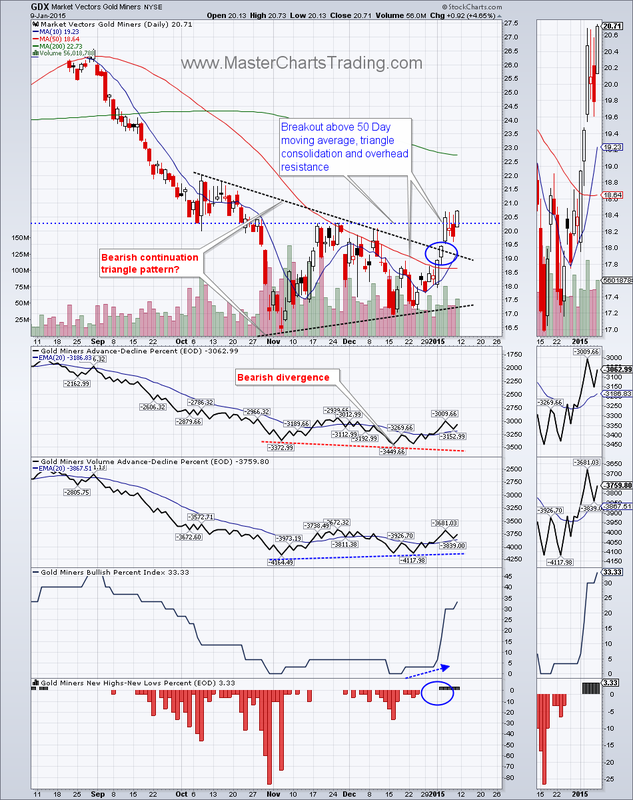
I highlighted the gold miners situation last week in details. I am still long-term bearish on the gold miners, but was ready to be proven wrong about the latest downswing. I was indeed proven wrong this week, as GDX broke out to the upside and on good breadth too. The breakout is holding so far.
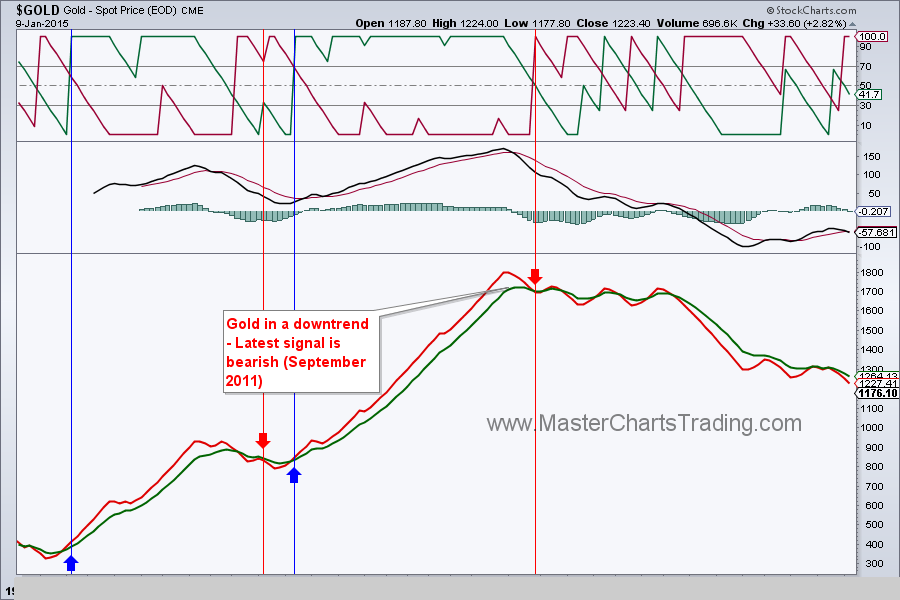
Gold itself is also long-term bearish, so I am treating this rally as a bear market rally for now. Gold would need to close above $1400 for me to be fully convinced that the bear market that started in 2011 is over.
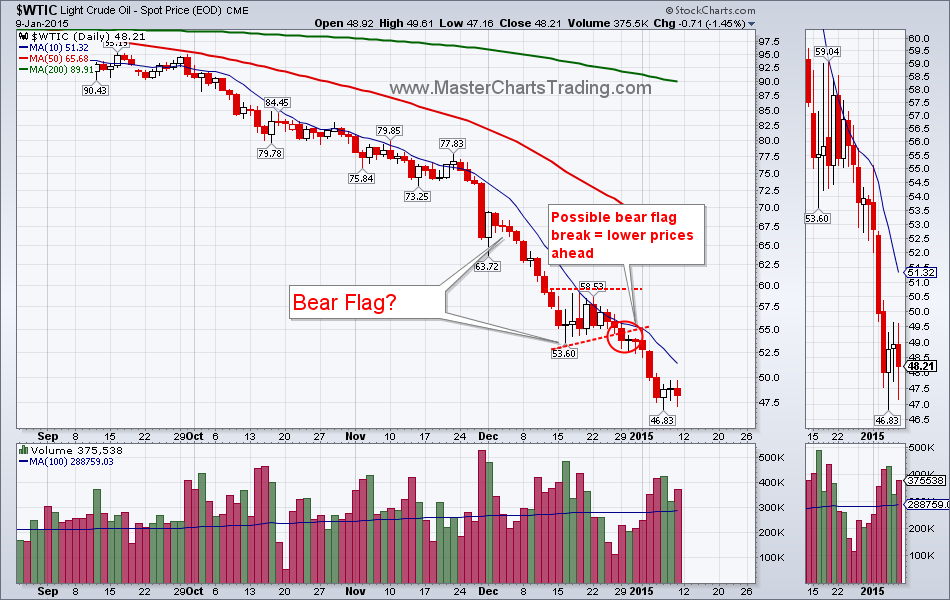
Oil keeps falling. Last week I posited that West Texas Intermediate Crude could easily go to the low $40s. We are on the way there, but it may not be a direct pass. I am seeing significant support around $46.
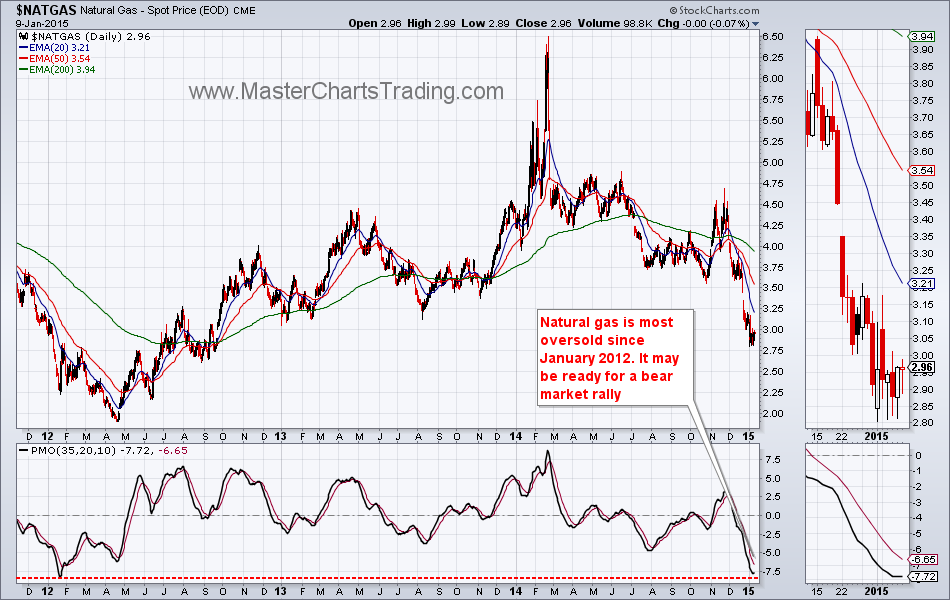
Finally, I wanted to revisit a commodity I haven’t covered in a while: Natural gas. First and foremost, natural gas is an extremely volatile commodity. This makes cutting your losses and controlling position size a top priority if the trade goes against you. Having said that, trading natural gas could be extremely rewarding.
$NATGAS entered its most recent bear market around February 2014. Since then there were 3 good selling opportunities (according to our trading system). One of them would have resulted in a breakeven, but the other two would have resulted in about 15 and 30% profits. These are marked on the chart of UNG below.
$NATGAS entered its most recent bear market around February 2014. Since then there were 3 good selling opportunities (according to our trading system). One of them would have resulted in a breakeven, but the other two would have resulted in about 15 and 30% profits. These are marked on the chart of UNG below.
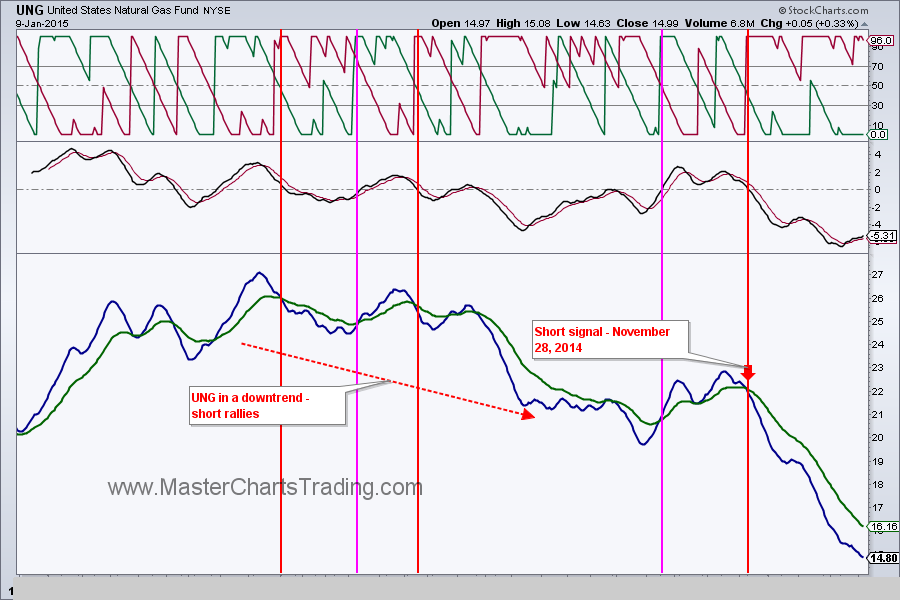
Currently $NATGAS is extremely oversold. In fact it hasn’t been this oversold since January 2012 and back then it rallied hard. First into a bear market rally that later transformed into a bull market with a total gain of over 200%!
Watch for the signals on our hourly $UNG chart to see if a tradable bear market rally is unfolding.
Watch for the signals on our hourly $UNG chart to see if a tradable bear market rally is unfolding.
That’s it for this week’s recap,
Best Regards and have another great trading week!
Alexander Berger (www.MasterChartsTrading.com)
Disclaimer: we have open positions in: SPY, AGG, TLT
New position: GLD, GDX
Closed position: DUST
Best Regards and have another great trading week!
Alexander Berger (www.MasterChartsTrading.com)
Disclaimer: we have open positions in: SPY, AGG, TLT
New position: GLD, GDX
Closed position: DUST


 RSS Feed