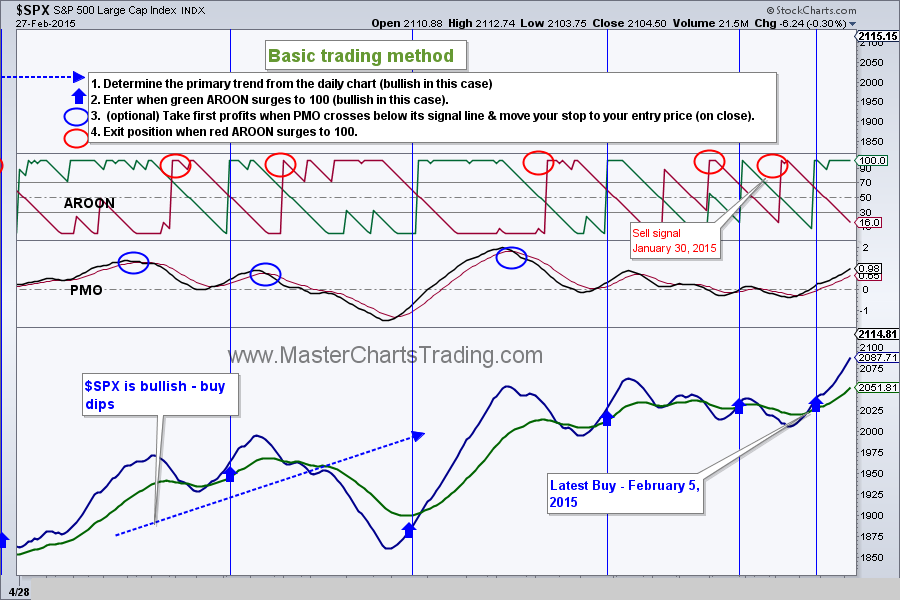
| Friday, February 27, 2015 Weekly Market Recap. Live charts for this update are located here. Major indices hit all-time highs yet again this week, but pulled back a bit by Friday to relieve the overbought conditions. I don’t think this upswing is done yet since no sell signal was generated by our trading system, although we did take some profits. Watch this video on YouTube here. | |
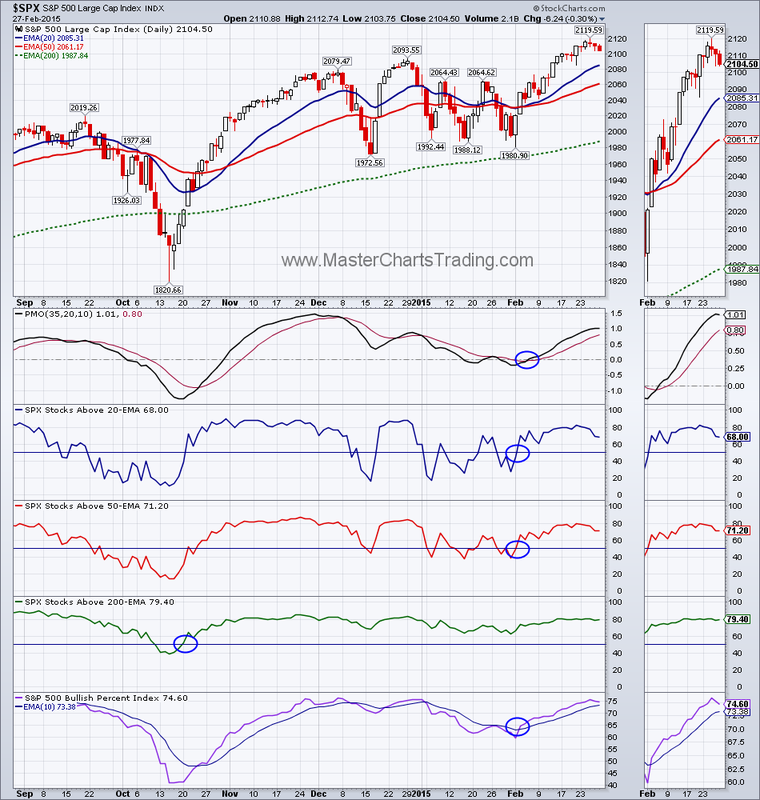
Market breadth deteriorated very slightly, but is still bullish. % of stocks above their 20 and 50 day exponential moving averages dropped slightly. I don’t think it is of major concern just yet.
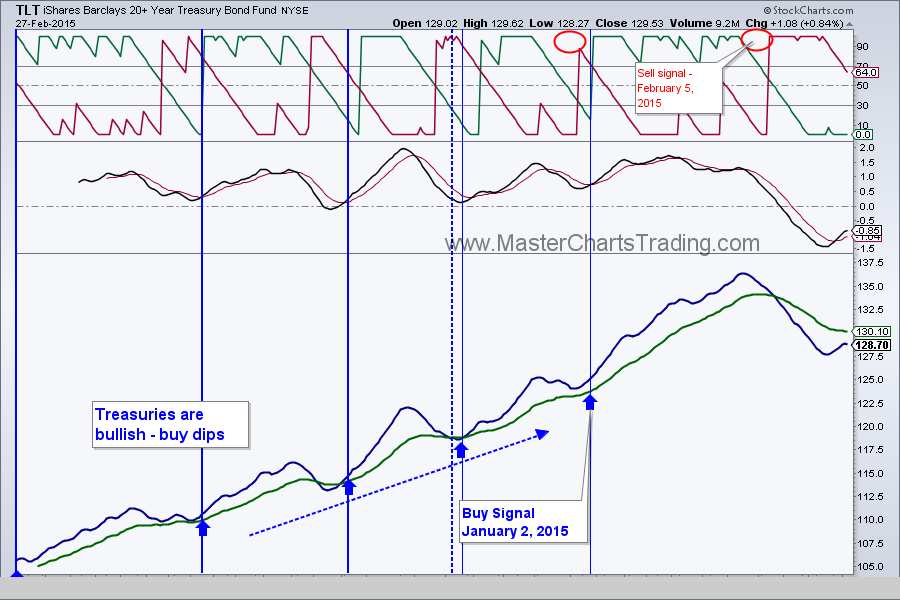
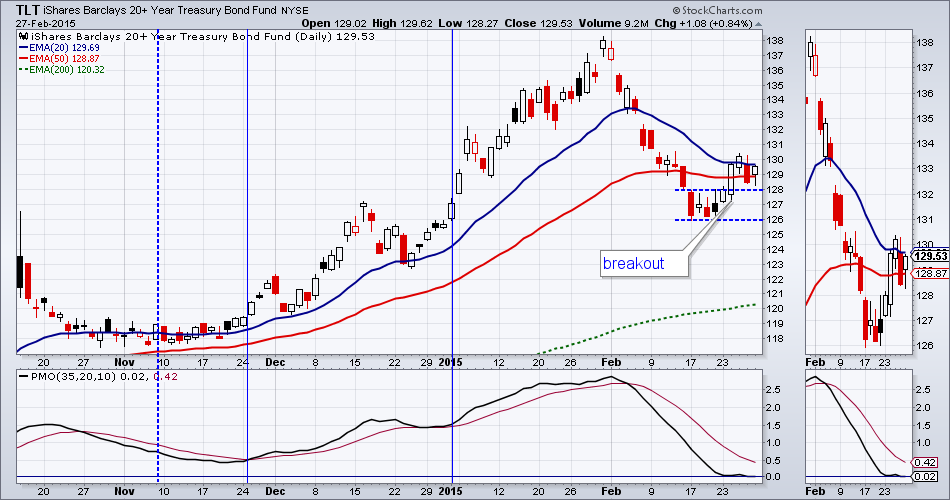
Bonds (TLT) broke out of its consolidation in the $126-128 area and seem to want to go higher. On Thursday and Friday it retested the breakout. The breakout is holding for now. We opened a small position TLT and may add more once buy signal is confirmed.
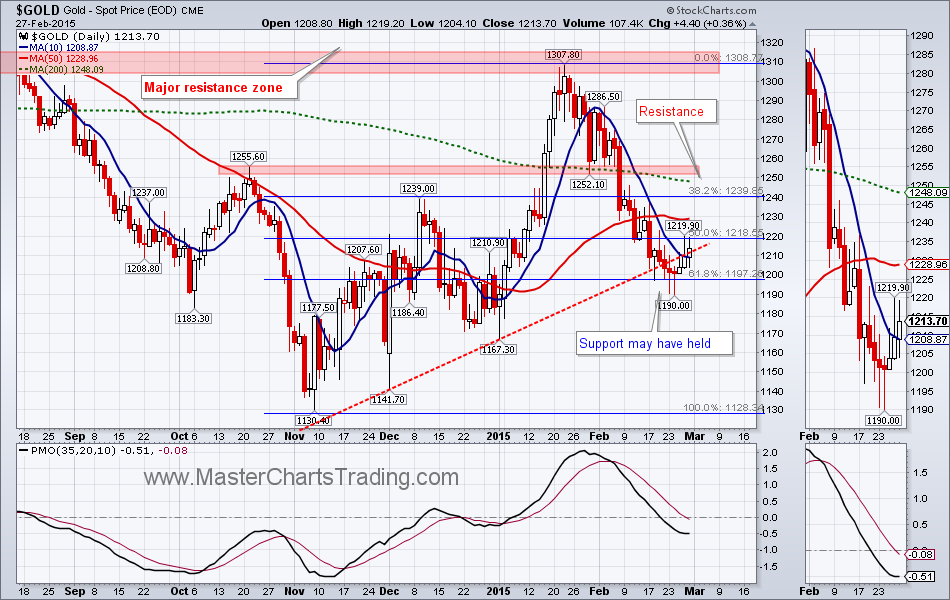
For the up move that started in November and ended in mid January, gold fell over 9%. It has now retraced 62% of this up move and seems to have held support here in the $1200 zone and rebounded. This is a positive development for gold.
We had an open position in DUST (inverse 3x GDX), which we closed on February 25th with a small gain. In this business it pays to keep an open mind. Even though I am long-term bearish on gold and gold equities, its not wise to argue with bullish price action in GDX. Seems like GDX broke out on Friday with a close above consolidation that started on February 17th.
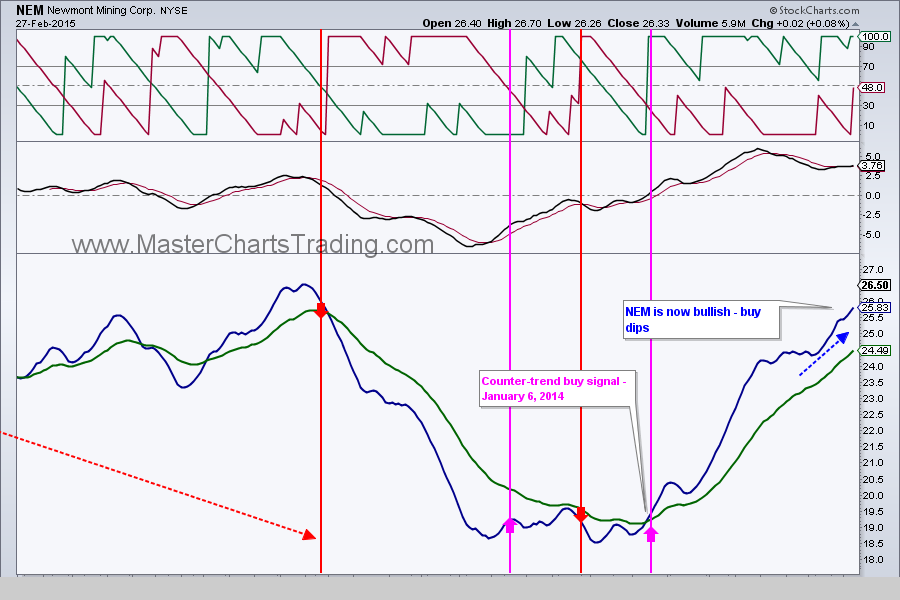
Gold miners market breadth also improved. Especially the bullish percent index ($BPGDM), when it held at 40%, was my first tell that there is underlying strength in gold miners (Newmont Mining turned long-term bullish recently).
Gold miners market breadth also improved. Especially the bullish percent index ($BPGDM), when it held at 40%, was my first tell that there is underlying strength in gold miners (Newmont Mining turned long-term bullish recently).

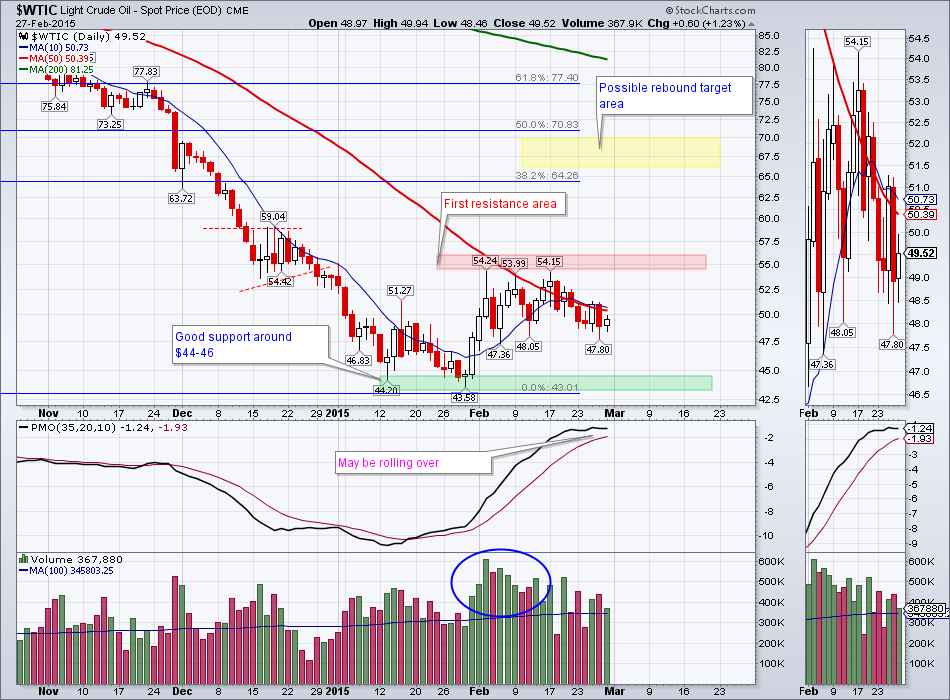
The strong US Dollar is pressuring commodities. So far oil failed to break above the resistance in the $54 area for 3 times. It is possible oil may head lower and retest its January lows. We went ahead and opened a small short position in Crude Oil by purchasing an inverse oil related ETF called SCO.

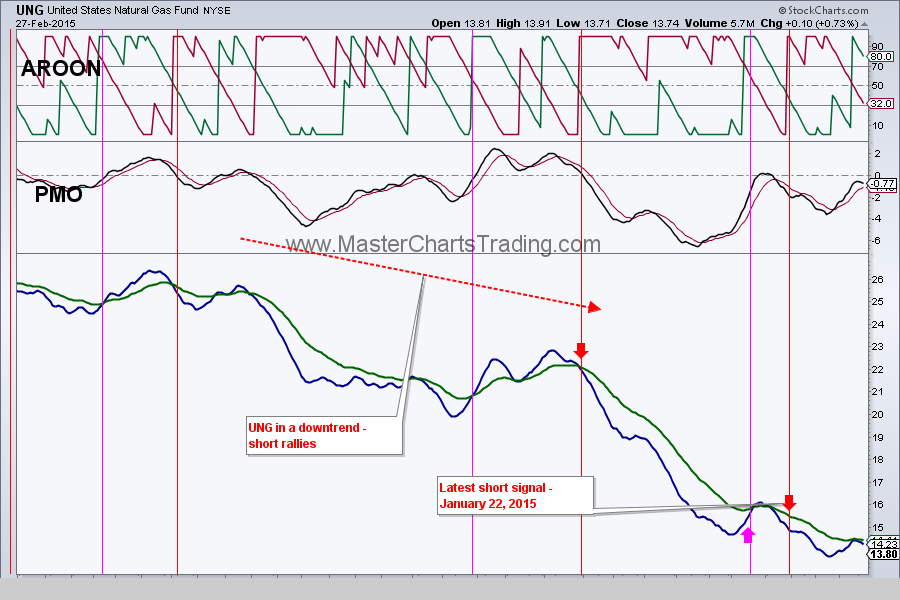
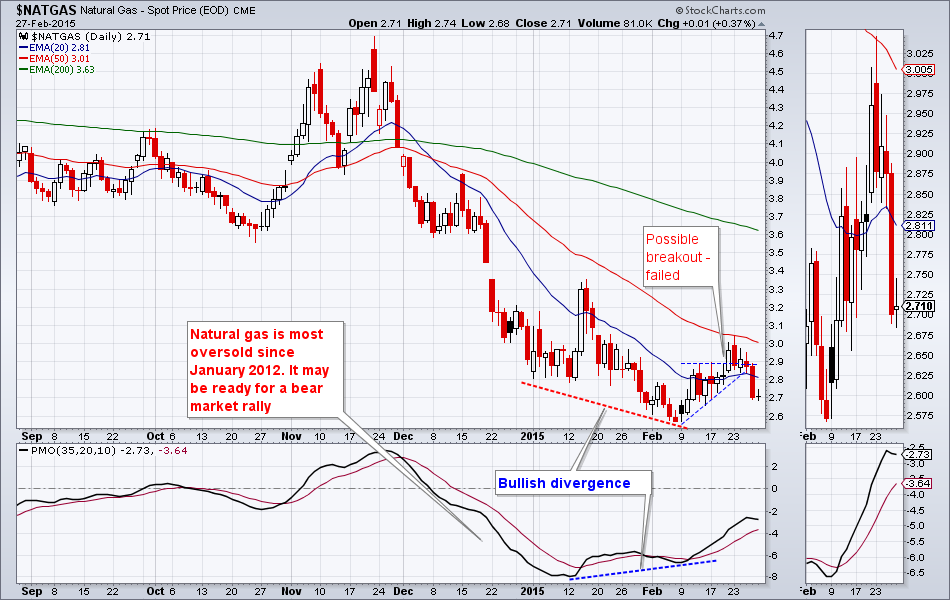
Finally I wanted to revisit $NATGAS that I highlighted last week as a possible candidate for a substantial rebound. Buy signal never materialized and the breakout from February 20th was never confirmed. It is very important to have a confirmation of breakout with a follow-thru, which in this case never happened. I remain bearish on $NATGAS long-term.
That’s it for this week’s recap,
Best Regards and have another great trading week!
Alexander Berger (www.MasterChartsTrading.com)
Disclaimer, we have:
Open positions: SPY (took profits)
New position: TLT, SCO
Closed position: DUST
Best Regards and have another great trading week!
Alexander Berger (www.MasterChartsTrading.com)
Disclaimer, we have:
Open positions: SPY (took profits)
New position: TLT, SCO
Closed position: DUST


 RSS Feed