| | Watch this week's video here. Over the past several weeks, we witnessed some extreme volatility in the markets. There was lots of chatter on Twitter about it. Even some seasoned traders, who were in the business for 20+ years mentioned that they “never seen anything like this”. Again, the long-term picture for the S&P 500 remains the same – it is bullish and for us that means looking for buying opportunities within this bigger uptrend. |
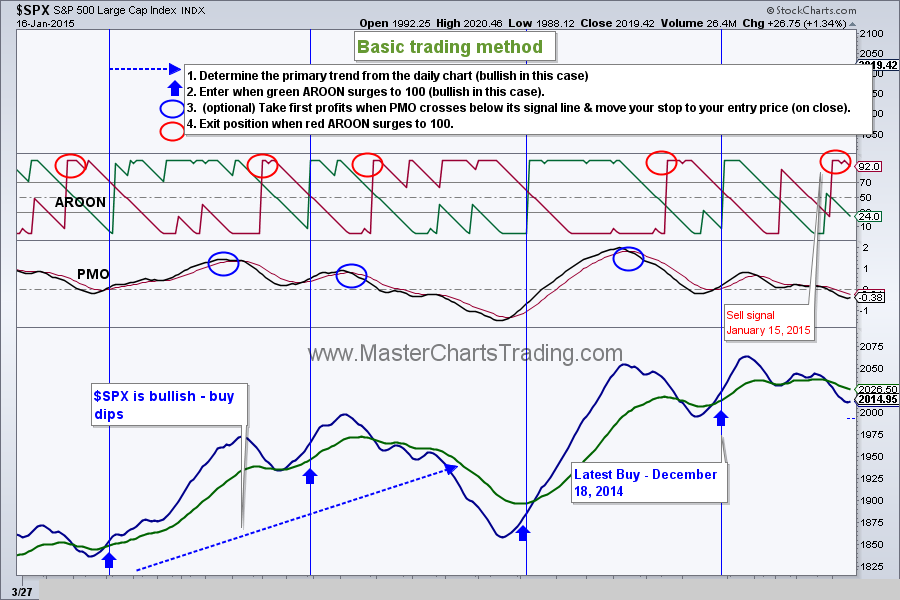
Our latest buy was on December 18th of last year. We finally exited this position on Thursday, January 15 for a loss of 1.05%. Losses will happen, its part of the business. The important thing is to admit to yourself that this trade did not go the way you wanted it, and move on with your trading life. New opportunities will undoubtedly present themselves.
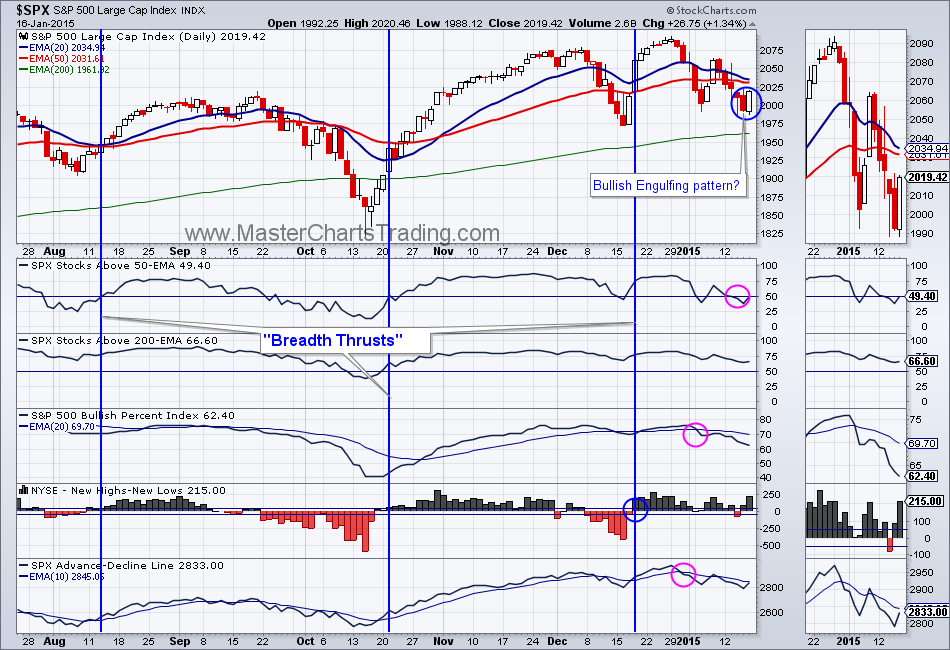
Market breadth is still more net positive then net negative. Percent of stocks above 50 day moving average dropped below 50. This means that less then 50% of stocks within the S&P 500 are above their 50 day moving average. Also, the Advance-Decline (AD) Line dropped below its January 6 low – not a good sign. Yet the New Highs-New lows indicator for $NYSE is still strongly positive and the Bullish Percent Index for $SPX is well above 50%. This indicates good participation in the market.
Market breadth is still more net positive then net negative. Percent of stocks above 50 day moving average dropped below 50. This means that less then 50% of stocks within the S&P 500 are above their 50 day moving average. Also, the Advance-Decline (AD) Line dropped below its January 6 low – not a good sign. Yet the New Highs-New lows indicator for $NYSE is still strongly positive and the Bullish Percent Index for $SPX is well above 50%. This indicates good participation in the market.
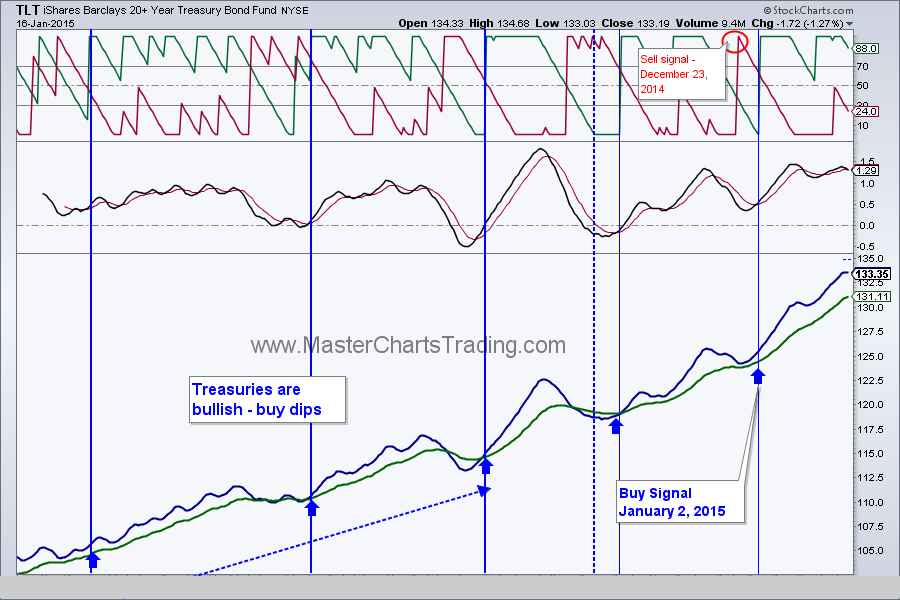
Safety assets are seeing a strong bid as a result of all the stock market volatility and the shock of collapsing oil prices. Bonds (TLT) hit yet another all-time high. We may be seeing some profit taking in TLT, however. On Friday TLT was off 1.27%. Bonds are very overbought and ripe for at least a consolidation or possible a pullback.
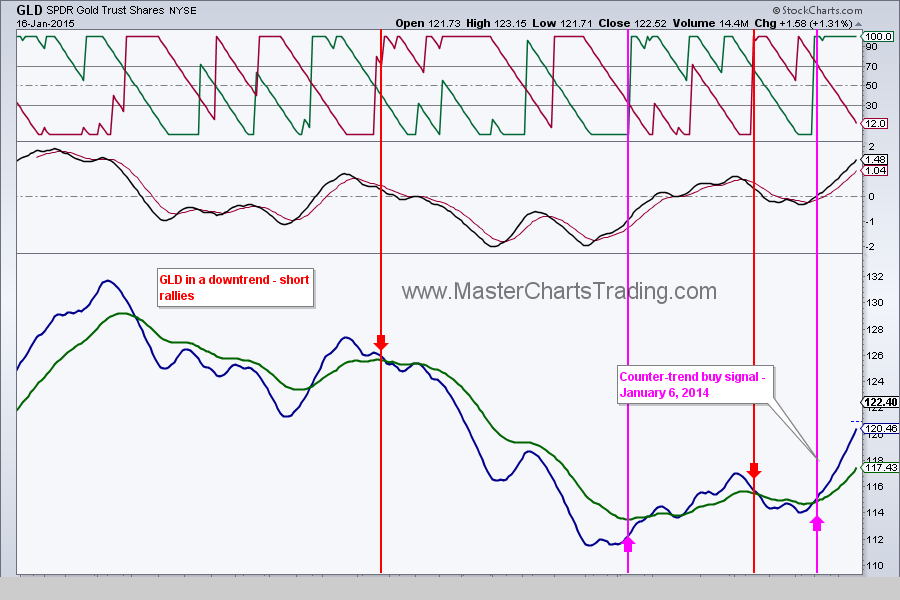
Gold got a strong bid following a surprise announcement by the Swiss Central Bank to stop their policy of capping the exchange rate of Euro to Swiss Frank. GLD is up a little over 4% from our entry point on January 6.
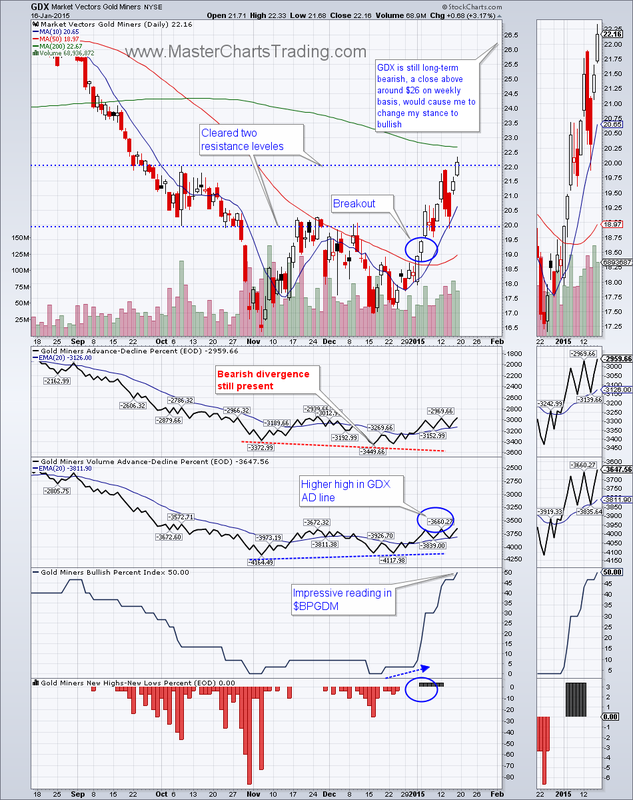
Market breadth for the gold miners improved dramatically. The Bullish percent index for the gold miners now stands at 50%, in stark contrast to just a month ago when it was at zero! GDX closed above an important resistance level on Friday. I am not ready to call GDX bullish just yet. A close above around $26 on a weekly basis would cause me to change my stance to bullish on GDX.
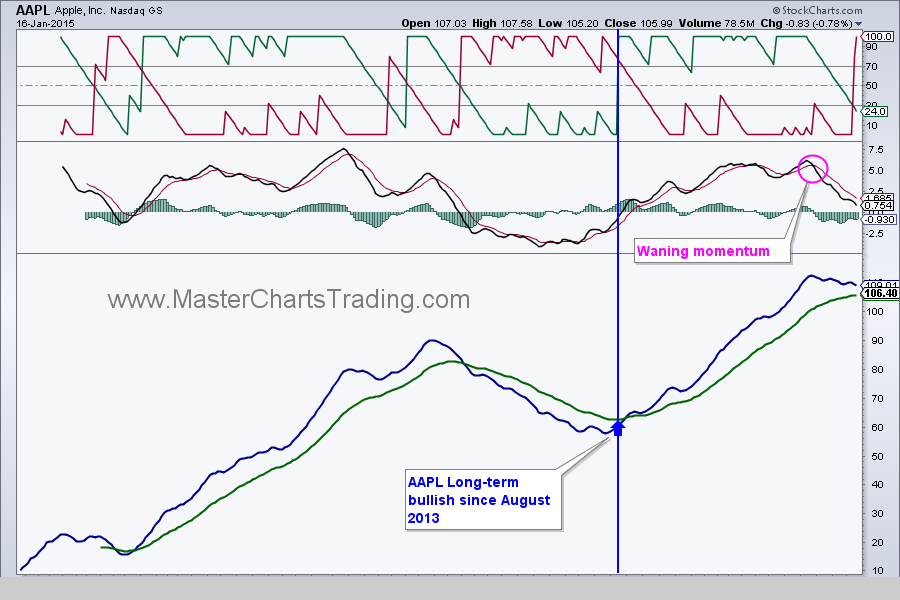
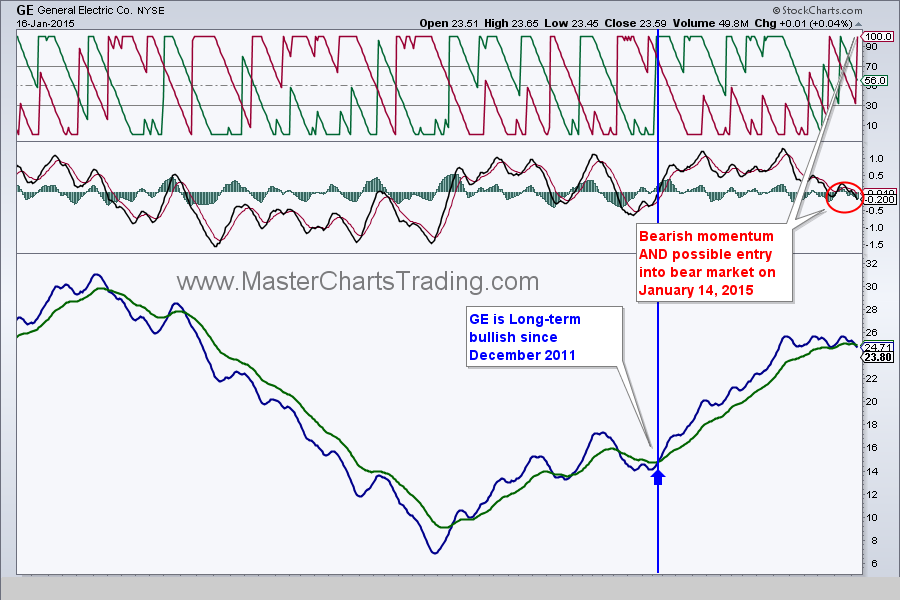
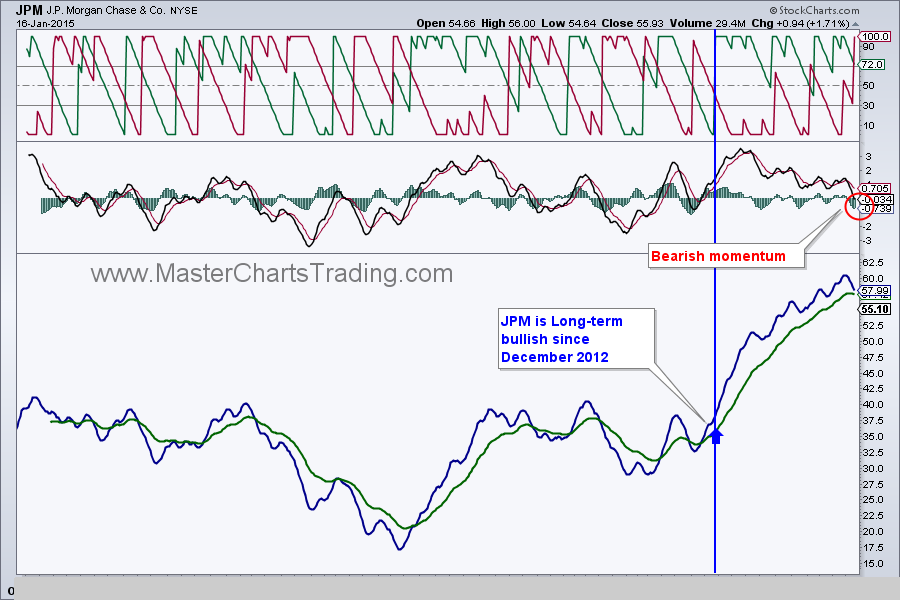
Some of the mega-cap stocks have been under pressure lately. Apple, General Electric andJP Morgan Chase are either in the process of rolling over into a bear market or already there. Not to mention Exxon Mobile and Chevron that have already rolled over into bear markets. This makes it 5 out of top 10 mega-cap stocks that are under strong pressure. These are important stocks that make up a large percentage of various indices. Should they roll over, it would be an ominous sign for the rest of the market.
- That’s it for this week’s recap,
- Best Regards and have another great trading week!
- Alexander Berger (www.MasterChartsTrading.com)
- Disclaimer: we have open positions in: AGG, TLT, GDX, GLD
- Closed position: SPY


 RSS Feed