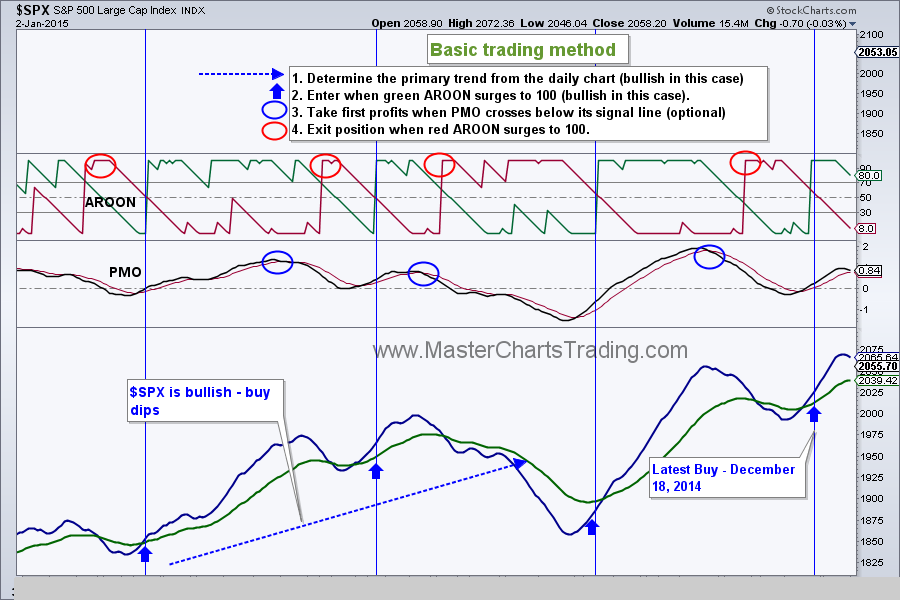
| | Friday, January 2, 2015 Weekly Market Recap. Watch video here. After hitting a new all-time high on December 29, markets sold-off rather sharply. This is a normal market behavior. Per our trading system, so far we are keeping our positions in stocks open and letting them breathe a bit. No sell signal in stocks on this upswing yet. |
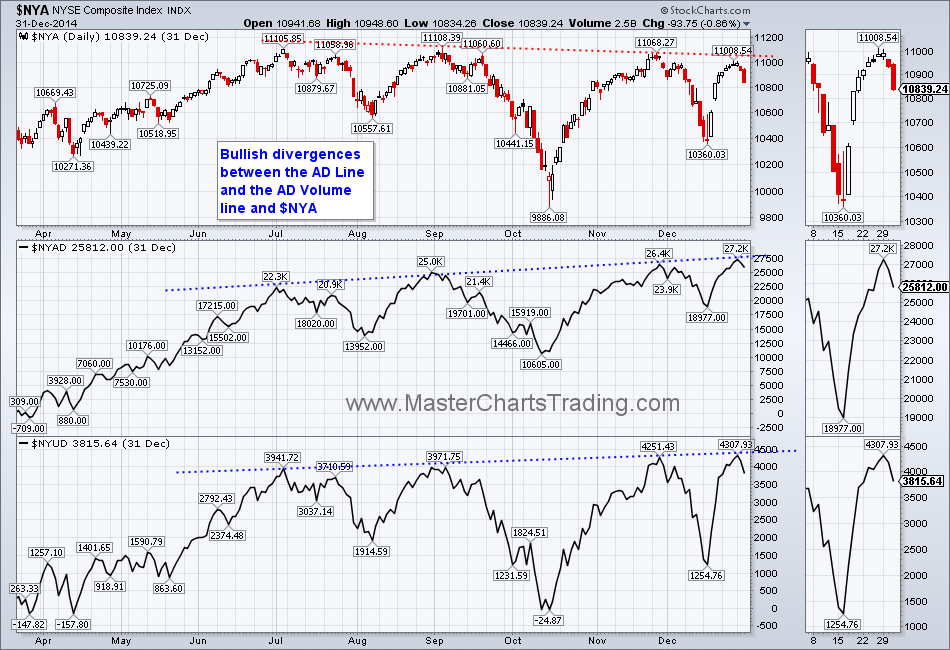
I highlighted a bullish divergence between the $NYSE Composite average and its Advance-Decline line last week. Again this divergence continues as NYSE makes lower high, yet the Advance-Decline and the Advance-Decline volume lines make higher highs. This is telling me that there is an underlying strength in the general stock market and higher prices in the $NYSE are likely to follow.
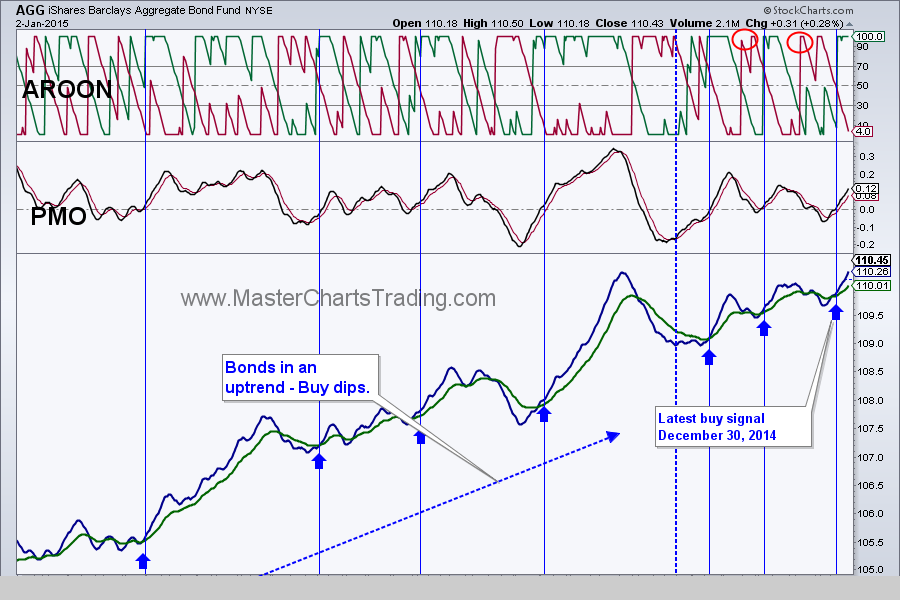
Bonds rebounded again and we re-opened a swing position in AGG and TLT. Looks like bonds are signaling a risk-off period in the stock market. Both stocks and bonds are hitting new all-time highs. Of course bonds remain vulnerable to the whims of the Federal Reserve interest rate policies. Should the Fed raise interest rates in 2015, bond prices will likely come under pressure.
I have been bearish on gold and gold miners for a long time, but in this newsletter, I will attempt to see if there is now sufficient evidence to turn (at least temporarily) bullish on gold and gold miners.
Gold and gold miners may be showing signs of either a failure of the latest downswing, or a possible long-term bottom in prices. If we look at the long-term picture on weekly charts, so far no major changes are visible. Gold miners have been in a downtrend since the end of 2011.
Gold and gold miners may be showing signs of either a failure of the latest downswing, or a possible long-term bottom in prices. If we look at the long-term picture on weekly charts, so far no major changes are visible. Gold miners have been in a downtrend since the end of 2011.
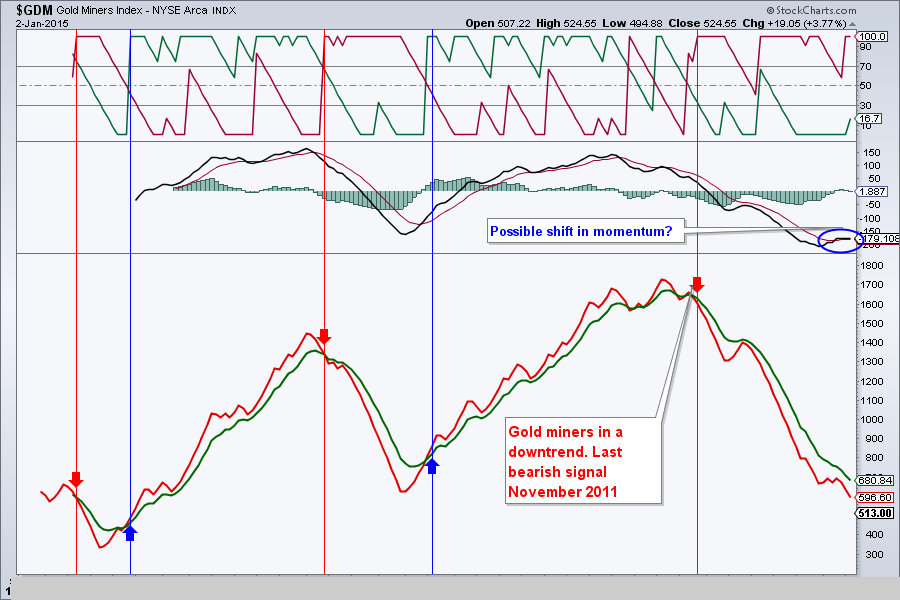
Along the way from 2011 there were several excellent selling (shorting) opportunities. Latest one of which happened around November 28 of 2014. However, this latest shorting iteration of GDX, so far has not been profitable, as the low in GDX from November 5, 2014 was not yet breached.
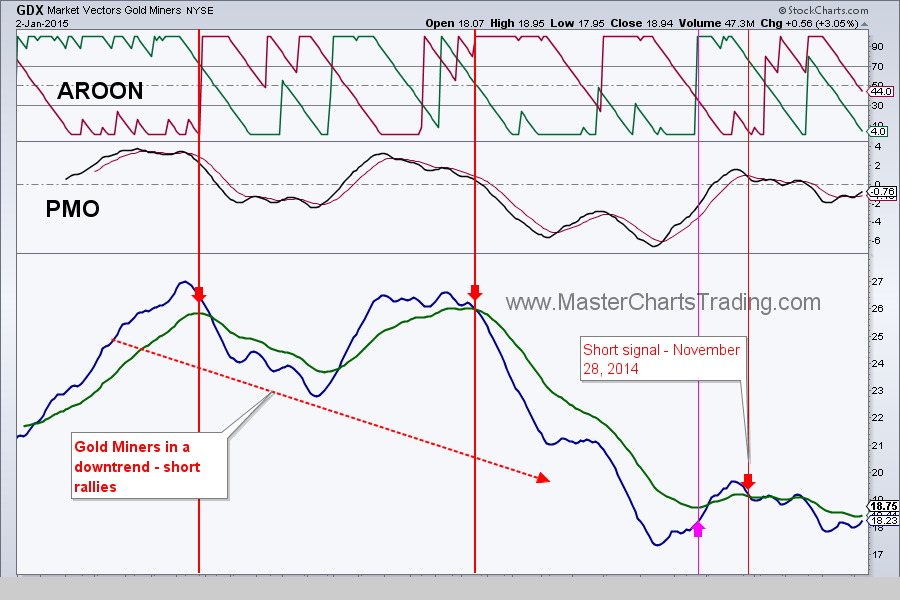
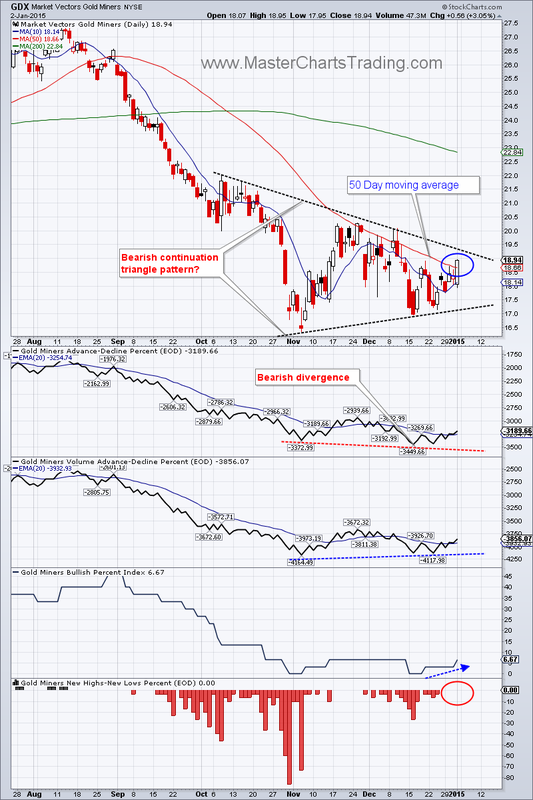
In fact GDX made a higher low on December 16, rallied into Friday, January 2nd and closed above the 50 day moving average with a bullish candlestick.
GDX market breadth also improved somewhat. As you can see from the chart below, there are several positive developments:
a. Bullish percent index for GDX is now at 6.67% and rising. This is hardly a bullish reading, but nevertheless an improvement from zero.
b. The Advance-Decline Percent Volume line (AD- Percent Volume line) made a higher low on December 23rd and is now also rising. This is telling me that the larger capitalization gold miners within GDX index are leading the index higher.
The rest of the gold miner’s market breadth indicators remain neutral or negative. In fact the AD-Percent line made a lower low on December 16th, while GDX itself made a higher low. This is called a bearish divergence – not a good sign.
Should GDX rally in the next few weeks and close above at least the bearish triangle trend line I drew, or better yet $20.26 (high from November 24th), I will call this latest downswing a failure. On the contrary, should GDX break the lower trend line of the triangle pattern, new lows will likely follow.
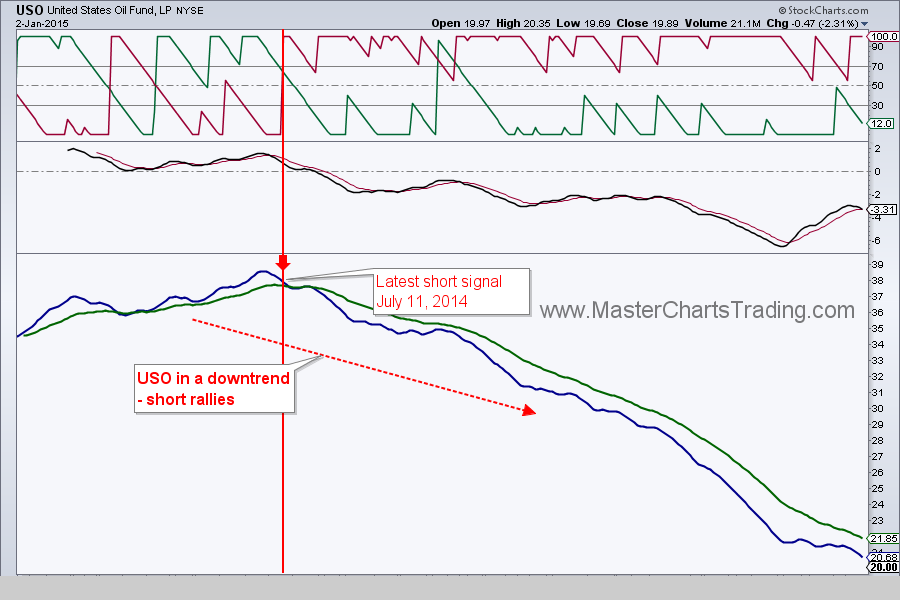
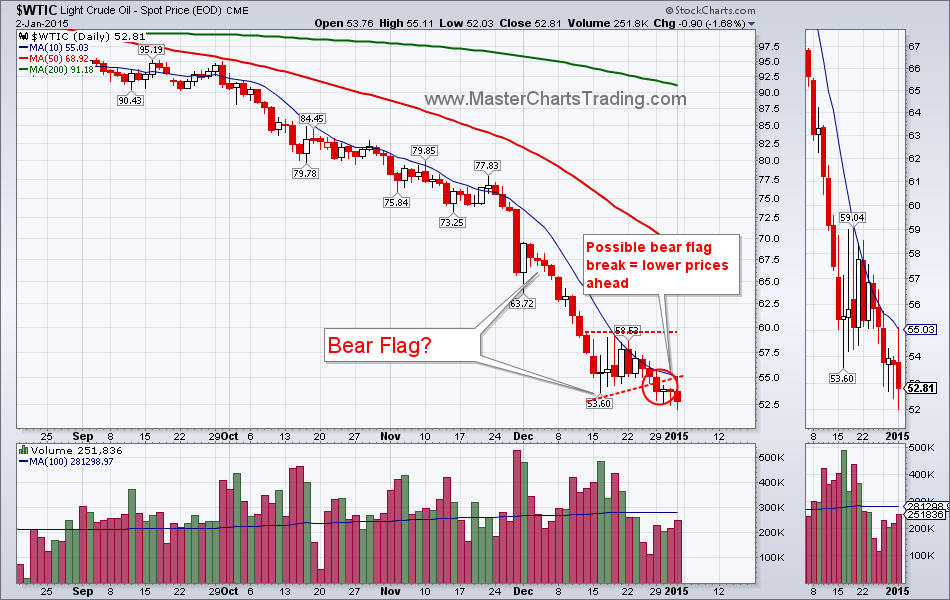
Finally, I still see no bottom in oil prices yet. On Friday, West Texas Intermediate Crude Oil ($WTIC) closed below the recent low of $53.60. It also broke the lower trend line from, what appears to be a bear flag I highlighted in my previous newsletter. Unless oil rallies from here, we can easily see prices in the lower $40s for oil soon.


 RSS Feed