Friday, February 14 (WEEKLY CHARTS)
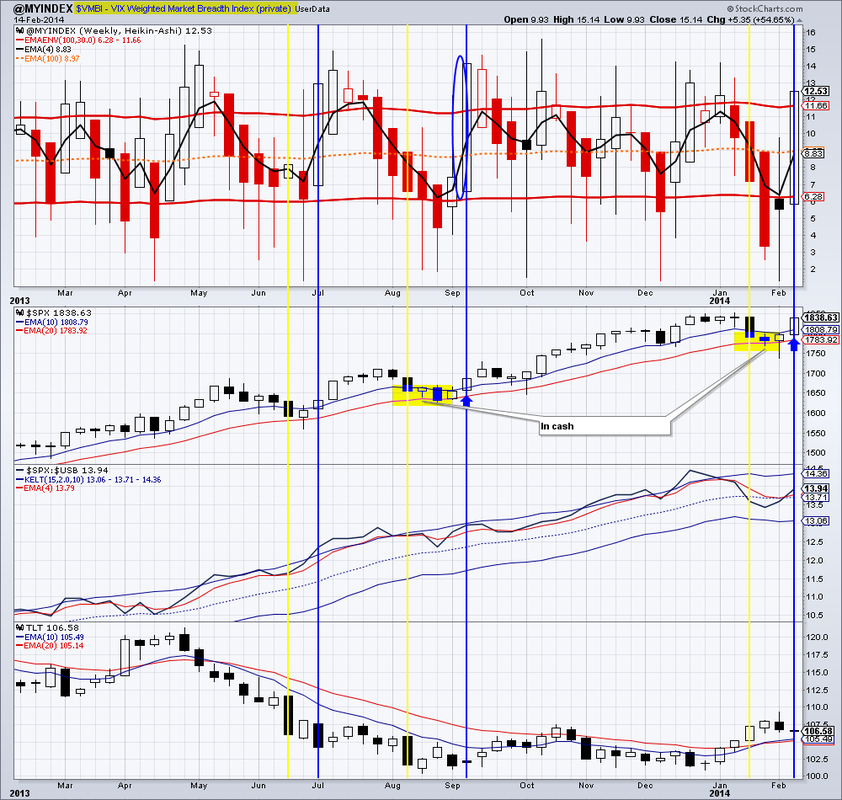
We finally got the bullish confirmation we were waiting for. Our proprietary market breadth index, the $VMBI, has turned strongly positive Friday at close on a weekly chart. This likely means higher prices for the major indices going forward. Next week we will be further increasing our stock exposure.
Interestingly, the bond market, held its own. TLT stayed above its 10 week eMA and printed a doji hammer. TLT’s momentum have turned down, but volume patterns remain bullish. A decisive close below its 10 week eMA would turn bond sentiment bearish and by extension, stock sentiment even more bullish.
$GOLD and GDX put in a stellar performance last week. $GOLD closed above its 20 week eMA for the first time in over a year on a bullish candle. Some sort of a pause this week is possible, but momentum and volume patterns are pointing to higher prices for the precious metal ahead.
$WTIC (USO) – oil, is as resistance and needs to close above $100.75 on weekly basis to continue its rally. Otherwise it can easily fall back to the $91 area again.
IYR – real estate, remained in a steep uptrend. This is likely to continue. It is coming up on resistance at $67.62. If it closes above this level, further upside to at least $68.31 is very much possible.
EEM – emerging markets may have put in a reversal 2 weeks ago. Momentum favors the bulls for now, but volume patterns remain a concern.
We are long: DVY, DEM, GDX, IYR


 RSS Feed