February 7, Friday (Weekly commentary)
Markets continued their oversold bounces. NASDAQ was a clear leader closing above its 50 DMA. While $IWM barely managed to touch its 10 DMA from below.
Stochastic indicators have turned up, but OBV - a volume indicator - has not confirmed this upturn. Generally when STO turns up first followed by OBV the signal is less robust then when the reverse is true - this is happening now.
$TLT firmed further as a result of a relatively disappointing jobs report. No short signal on $TLT yet, as volume patterns favors a bullish case.
$IYR continued its climb, negating the recent downturn in OBV. $IYR chart pattern looks like a cup and handle. If true, a move up of around 6% is possible.
$GOLD and $GDX firmed further and may continue their rally.
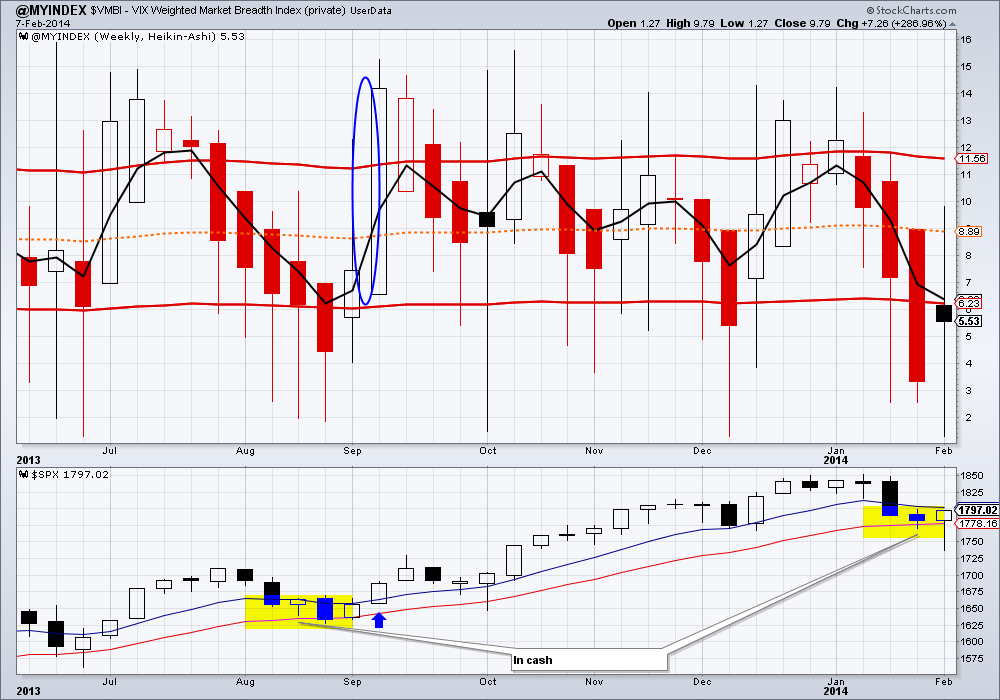
Our proprietary market breadth index, the $VMBI rose to a mildly bearish 5.53 from a moderately bearish 3.33 on the weekly chart. But judging from the strength of the recent sell-off we believe the short-term bias is still bearish.
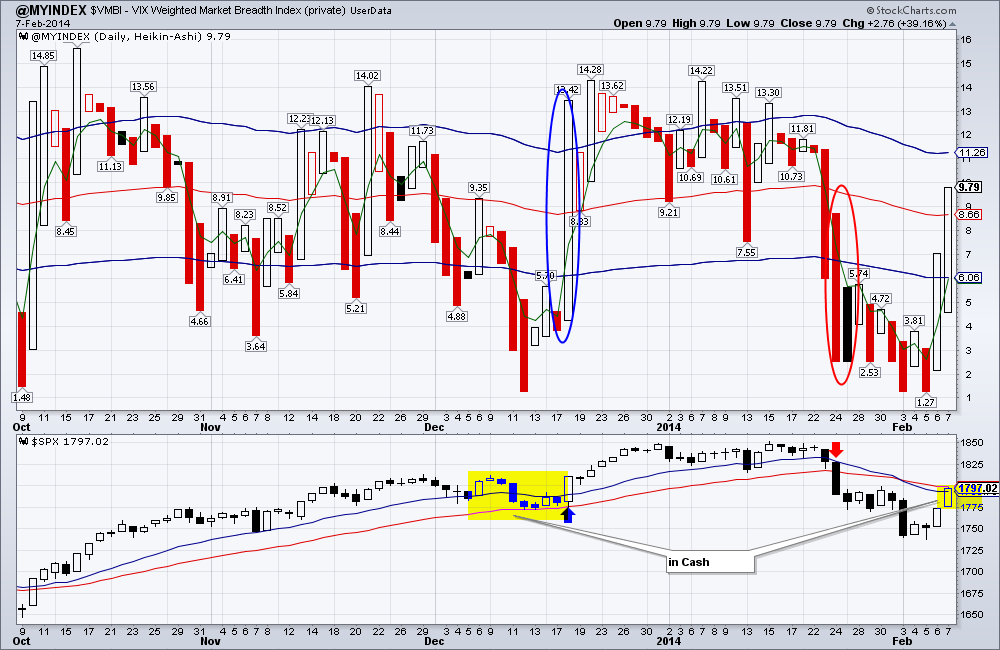
On the daily chart of $SPX our short position was stopped out of at a small profit. $VMBI on the daily chart looks better then on the weekly, but bias remains bearish.
This signal for us to stay out of the general market until a clear direction is found. We are long $TLT, $GDX, $IYR.
Markets continued their oversold bounces. NASDAQ was a clear leader closing above its 50 DMA. While $IWM barely managed to touch its 10 DMA from below.
Stochastic indicators have turned up, but OBV - a volume indicator - has not confirmed this upturn. Generally when STO turns up first followed by OBV the signal is less robust then when the reverse is true - this is happening now.
$TLT firmed further as a result of a relatively disappointing jobs report. No short signal on $TLT yet, as volume patterns favors a bullish case.
$IYR continued its climb, negating the recent downturn in OBV. $IYR chart pattern looks like a cup and handle. If true, a move up of around 6% is possible.
$GOLD and $GDX firmed further and may continue their rally.
Our proprietary market breadth index, the $VMBI rose to a mildly bearish 5.53 from a moderately bearish 3.33 on the weekly chart. But judging from the strength of the recent sell-off we believe the short-term bias is still bearish.
On the daily chart of $SPX our short position was stopped out of at a small profit. $VMBI on the daily chart looks better then on the weekly, but bias remains bearish.
This signal for us to stay out of the general market until a clear direction is found. We are long $TLT, $GDX, $IYR.


 RSS Feed