Friday, March 7, 2014 (weekly commentary)
Weekly Evidence is Still Bullish
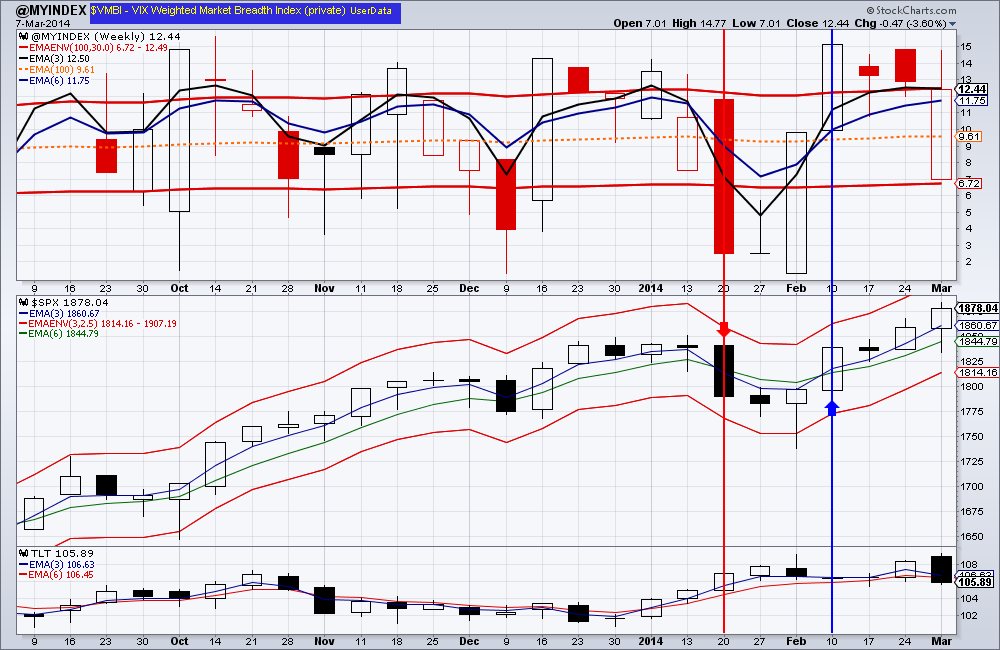
Indices gained for the week with Russell 2000 Small Caps gaining as much as 1.71%. Is that a sign that the markets would head lower from here? We have to look at what *is* happening and try to ignore what we hope *might* happen.
The bullish evidence
1. The slopes of both the 3 and the 6 week exponential moving averages (EMA) for S&P 500 are up.
2. The 3 week EMA is above the 6 week EMA
3. $SPX is making new highs for a second week in a row
4. Our Market Breadth Index, the $VMBI, is showing bullish readings.
5. TLT closed down 2.23% for the week. This could be considered a positive for the stock market. TLT hasn’t decisively closed below the support $105.36 yet, nor the 3 week EMA closed below the 6 week EMA, so we left a small position open
The bearish evidence
1. Markets are overbought. This again doesn’t mean a correction is imminent or there is an underlying weakness. Quite the opposite, it takes a strong buying pressure to push markets into an overbought territory.
2. Market Breadth Index, the $VMBI, has closed below its 3 week EMA. In the past this indicated a slight uptick in selling pressure - not enough to issue a bear alert just yet.
Gold and the gold miners closed up for the week. It appears that the rally that started at the end of last year in gold still continues. GDX has run into some resistance around $26.90 last week, but has not yet rolled over or showed significant signs of selling pressure.
Real Estate has been on a stellar run since the early December. This week, however, it printed what looks like a shooting star candlestick. If next week we get a confirmation of a turn in sentiment, we may book some profits.
Oil closed the week at $102.66 and printed what looks like a spinning stop candlestick – indicating indecision. Oil also may be running into a change of sentiment. Next week should provide clarity on direction
Natural gas seems to have held support at $4.46, but the 3 week EMA has now closed below the 6 week EMA. The 6 week EMA should now act as overhead resistance, currently at $4.92. Weekly candlestick pattern for natural gas is starting to look like a bear flag. Should this bear flag pan-out, another leg down of 20-30 percent is possible.
Emerging markets may have finally made a turnaround. This week the 3 week EMA (just barely) closed above the 6 week EMA for the first time since last November. On Balance volume patterns have also been steadily improving since the beginning of February. We opened a small position in EEM as a result.
Bottom line:
We feel that stock market conditions still favor the bullish side. Should the conditions deteriorate, we will decrease our equity exposure and shift into more advantageous asset classes, such as bonds or gold, and/or hedge against the decline.
We are long: GDX, IYR, TLT, EEM, DVY, ETV
Weekly Evidence is Still Bullish
Indices gained for the week with Russell 2000 Small Caps gaining as much as 1.71%. Is that a sign that the markets would head lower from here? We have to look at what *is* happening and try to ignore what we hope *might* happen.
The bullish evidence
1. The slopes of both the 3 and the 6 week exponential moving averages (EMA) for S&P 500 are up.
2. The 3 week EMA is above the 6 week EMA
3. $SPX is making new highs for a second week in a row
4. Our Market Breadth Index, the $VMBI, is showing bullish readings.
5. TLT closed down 2.23% for the week. This could be considered a positive for the stock market. TLT hasn’t decisively closed below the support $105.36 yet, nor the 3 week EMA closed below the 6 week EMA, so we left a small position open
The bearish evidence
1. Markets are overbought. This again doesn’t mean a correction is imminent or there is an underlying weakness. Quite the opposite, it takes a strong buying pressure to push markets into an overbought territory.
2. Market Breadth Index, the $VMBI, has closed below its 3 week EMA. In the past this indicated a slight uptick in selling pressure - not enough to issue a bear alert just yet.
Gold and the gold miners closed up for the week. It appears that the rally that started at the end of last year in gold still continues. GDX has run into some resistance around $26.90 last week, but has not yet rolled over or showed significant signs of selling pressure.
Real Estate has been on a stellar run since the early December. This week, however, it printed what looks like a shooting star candlestick. If next week we get a confirmation of a turn in sentiment, we may book some profits.
Oil closed the week at $102.66 and printed what looks like a spinning stop candlestick – indicating indecision. Oil also may be running into a change of sentiment. Next week should provide clarity on direction
Natural gas seems to have held support at $4.46, but the 3 week EMA has now closed below the 6 week EMA. The 6 week EMA should now act as overhead resistance, currently at $4.92. Weekly candlestick pattern for natural gas is starting to look like a bear flag. Should this bear flag pan-out, another leg down of 20-30 percent is possible.
Emerging markets may have finally made a turnaround. This week the 3 week EMA (just barely) closed above the 6 week EMA for the first time since last November. On Balance volume patterns have also been steadily improving since the beginning of February. We opened a small position in EEM as a result.
Bottom line:
We feel that stock market conditions still favor the bullish side. Should the conditions deteriorate, we will decrease our equity exposure and shift into more advantageous asset classes, such as bonds or gold, and/or hedge against the decline.
We are long: GDX, IYR, TLT, EEM, DVY, ETV


 RSS Feed