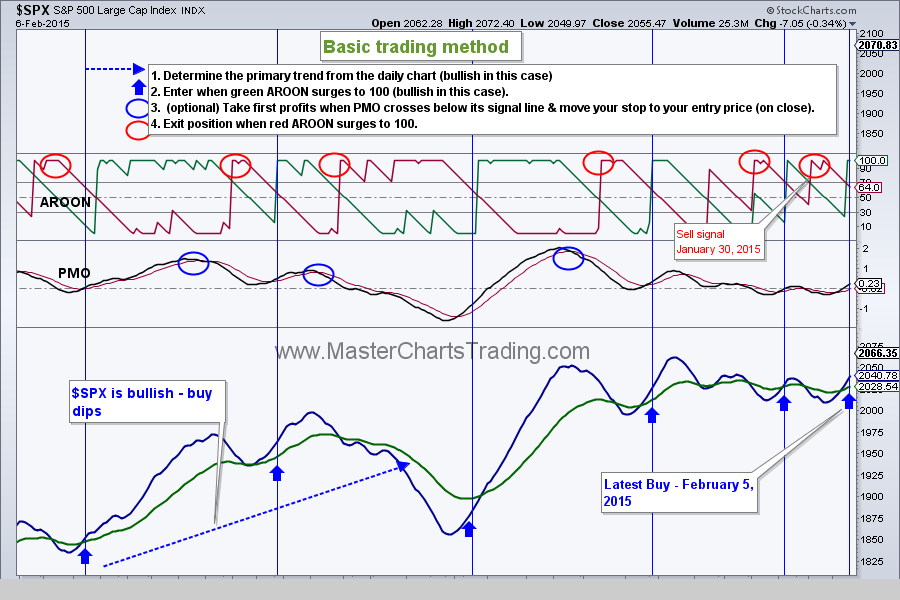
| | www.MasterChartsTrading.com Friday, February 6, 2015 Weekly Market Recap. It appears that the bigger uptrend is pulling trump again. The choppy mess of a market we have been wading through seems to be ending and new highs are now more likely then a week ago. We closed our SDS position and went long on February 5th. |
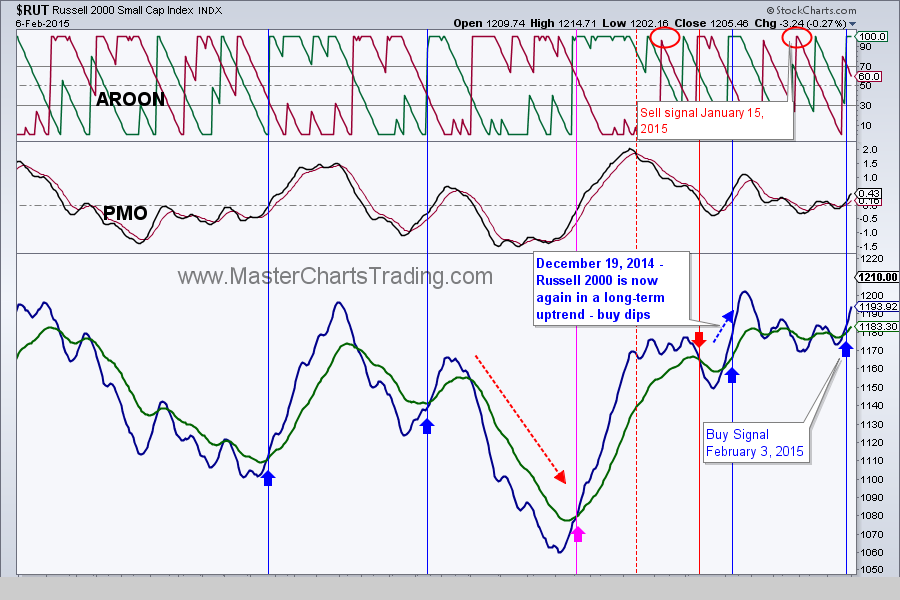
The Russell 2000 small cap index is doing better then its large cap cousin, as our system generated a buy signal on the Russell two full days earlier on February 3rd.
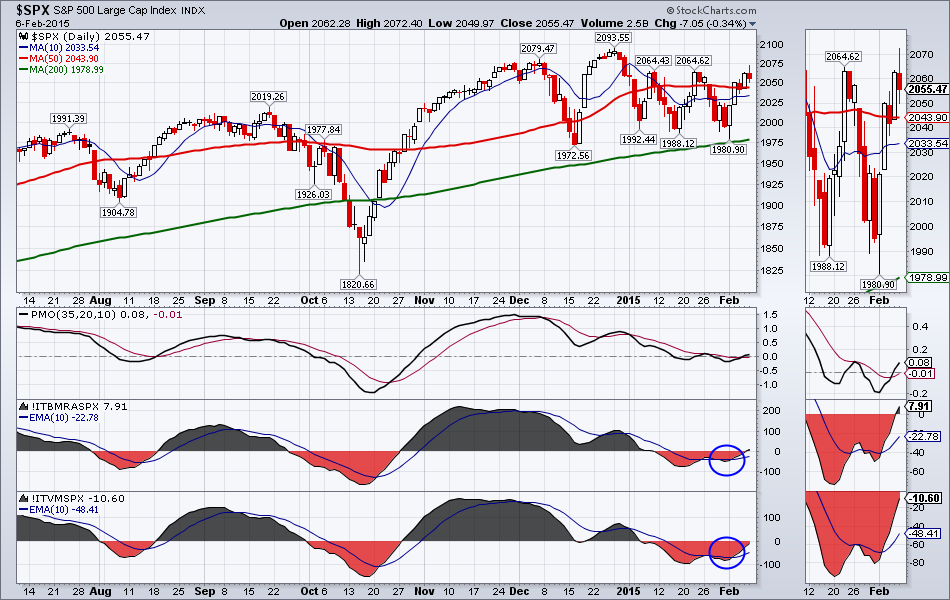
I believe we had a “breadth thrust” on February 3rd as many stocks flipped onto buy signals within the various indices ($NYA, $COMPQ, $SPX, etc.) Overall market breadth is looking bullish. A close above 2065 for the S&P 500, for two consecutive days would be most welcome and help the bullish cause greatly.
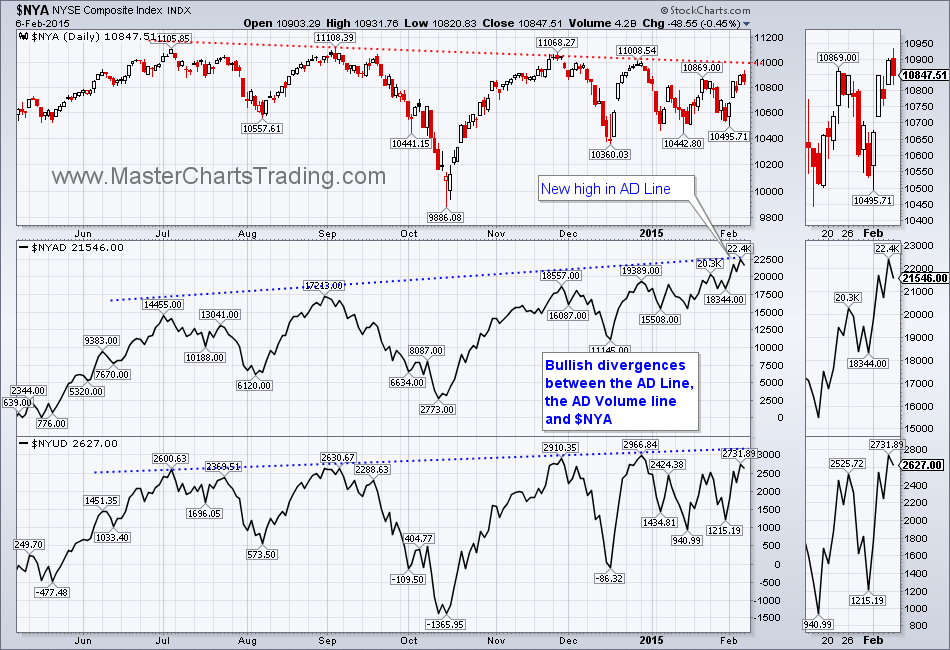
Also a bullish divergence is still present in the $NYA. Bullish divergence happens when the price of an index is trending lower, but its Advance-Decline lines are trending higher. In fact the New York Stock Exchange Advance Decline line hit an all-time high on February 5th.
Also a bullish divergence is still present in the $NYA. Bullish divergence happens when the price of an index is trending lower, but its Advance-Decline lines are trending higher. In fact the New York Stock Exchange Advance Decline line hit an all-time high on February 5th.

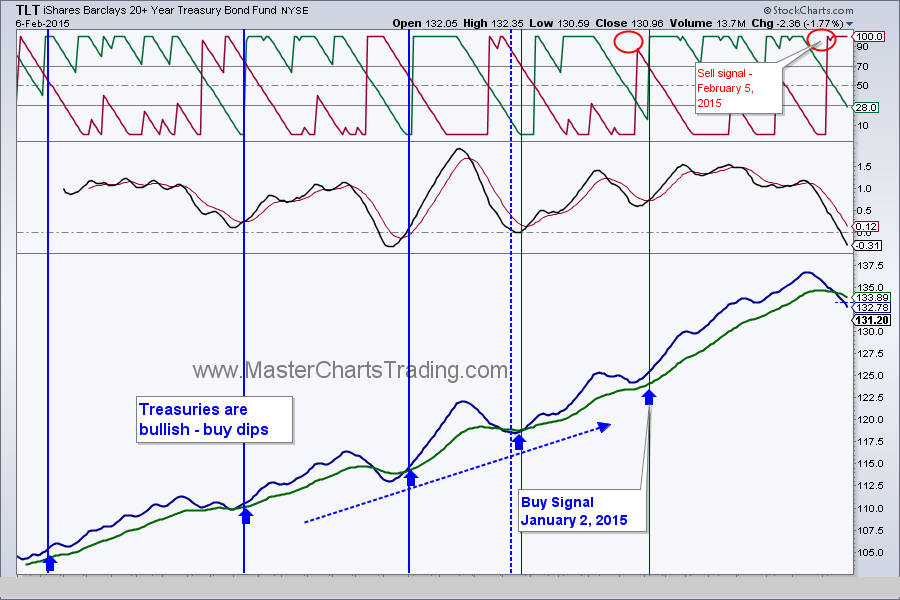
Bonds took it on the chin on February 5th, just as stocks surged. Treasuries (TLT) are down over 5% from the all-time high they set just on January 30th. Our system told us to get out of bonds on February 5th and we booked over 6% in profits. Needless to say, bonds are in a strong uptrend, so this could be considered a normal pullback within a bigger uptrend.
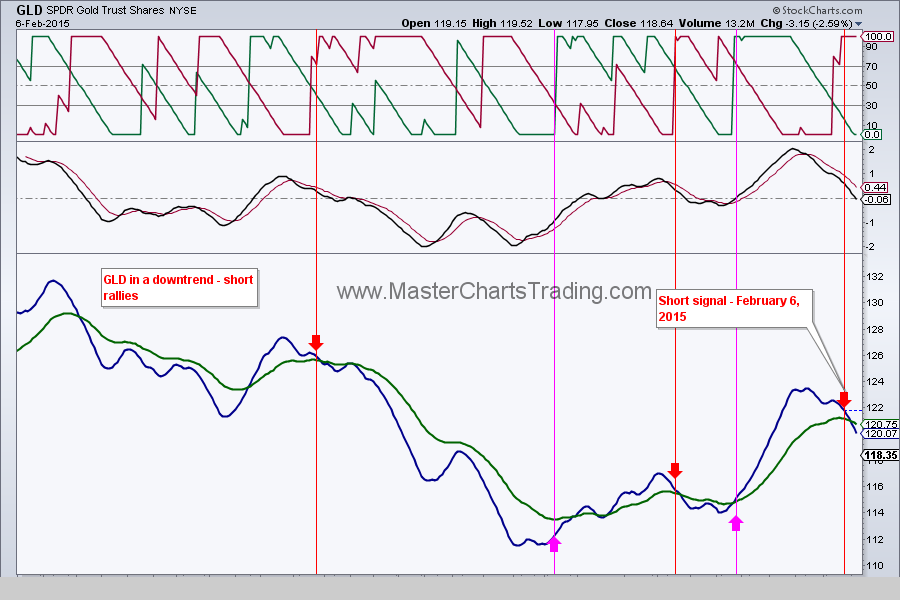
Gold is in a long-term downtrend, so today’s sell-off comes as no surprise to me. Last week I mentioned that gold ran into a massive resistance zone around $1300 and pulled back. Today gold closed below a support level dating back to June 3rd of last year. We closed our long positions in GDX and GLD.
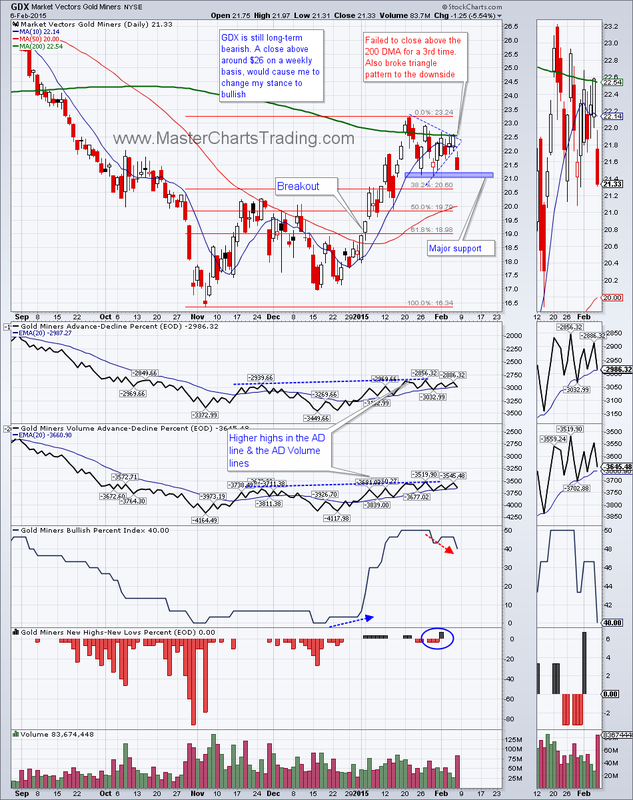
Gold miners could be thought as an extension of gold itself. The correlation coefficient between gold and gold miners is very positive. GDX followed gold’s suit and dropped over 5.5% today. Per our trading system GDX did not yet trigger a short signal, but as I mentioned above regarding the correlation, we went ahead and opened a short in the gold miners via an inverse ETF – DUST.
GDX failed to close above its 200 day moving average for two days in a row, now for the 3rd time. In the morning it gapped down, rebounded, and closed near the day’s lows. It is now near its major support from January 29th low. Should that give, we could easily see GDX retest at least the $20 area and possibly even lower.
GDX failed to close above its 200 day moving average for two days in a row, now for the 3rd time. In the morning it gapped down, rebounded, and closed near the day’s lows. It is now near its major support from January 29th low. Should that give, we could easily see GDX retest at least the $20 area and possibly even lower.
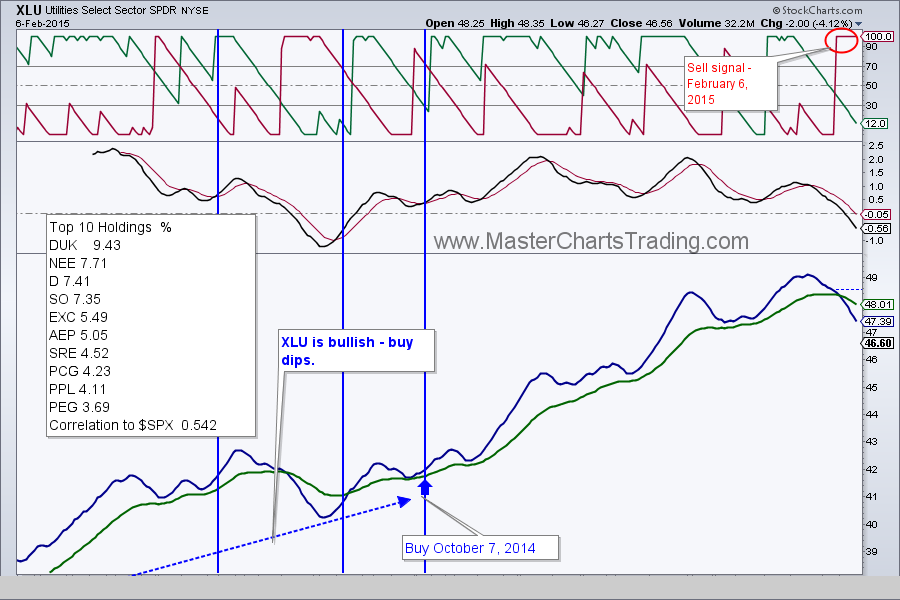
As the bond market sold-off, so did the interest rate sensitive sectors of the stock market: REITS and utilities. Our system generated a sell signal on XLU, which would have resulted in about 14% gain since the entry on October 7th of last year.
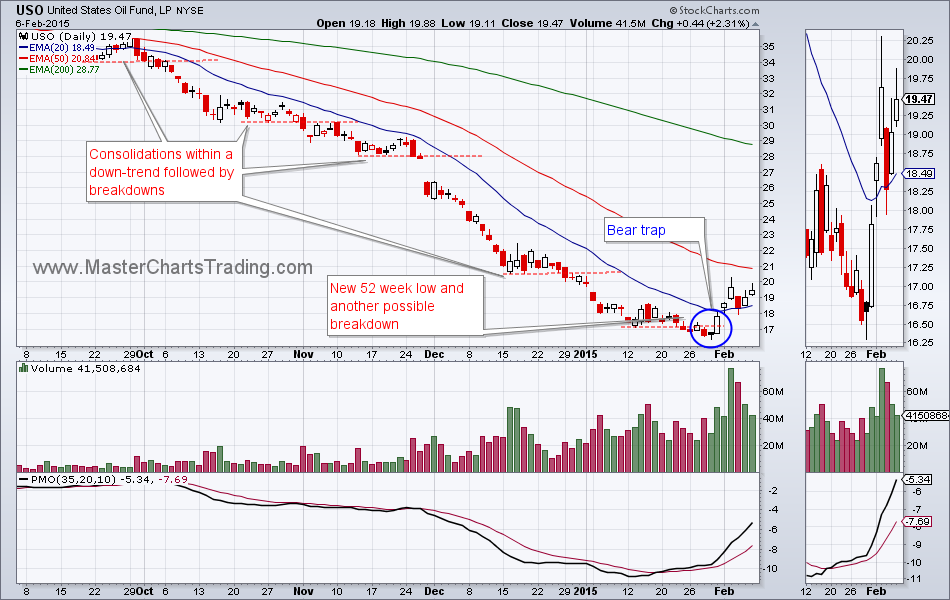
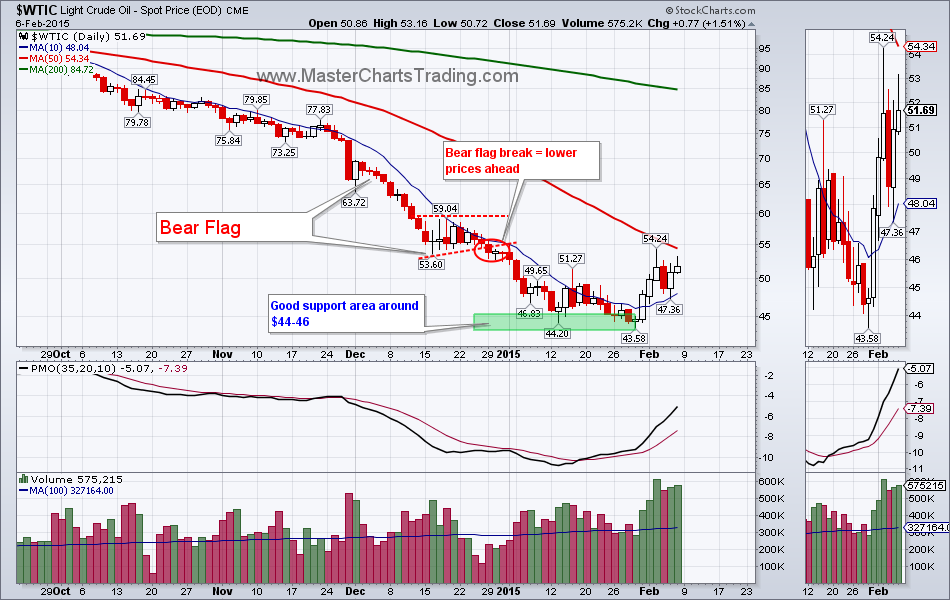
Oil seems to be stabilizing and a counter-trend buy signal was generated by our trading system on February 2nd in USO (a trade able oil vehicle). It is up a little over 5%. As I mentioned before, there is now good support for West Texas Intermediate Oil in the $44-46 area.
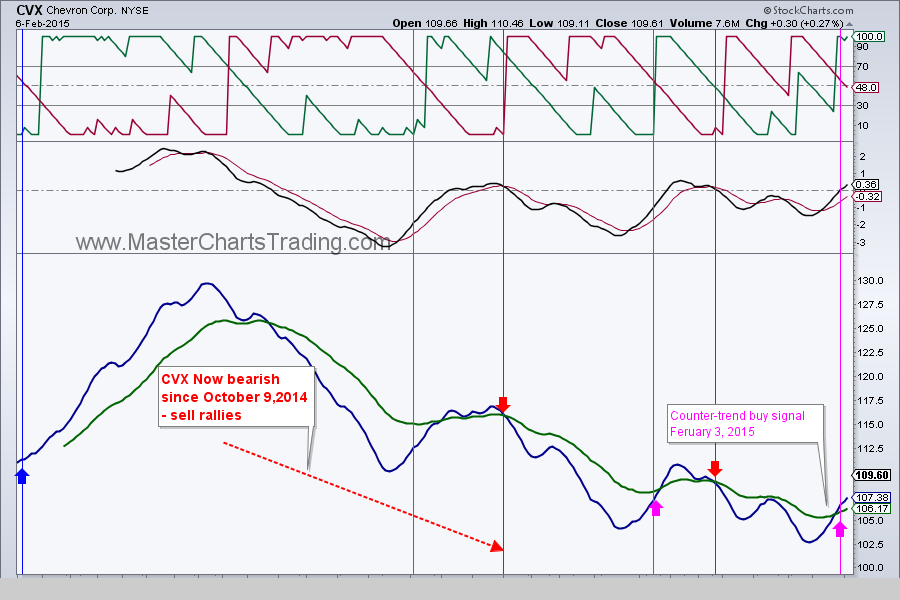
Along with oil, energy related stocks are stabilizing. For example Chevron (CVX) went on a counter-trend buy signal on February 3rd.
Along with oil, energy related stocks are stabilizing. For example Chevron (CVX) went on a counter-trend buy signal on February 3rd.

That’s it for this week’s recap,
Best Regards and have another great trading week!
Alexander Berger (www.MasterChartsTrading.com)
Disclaimer, we have:
Open positions: SPY, DUST
New position: SPY, DUST
Closed position: SDS, GDX, GLD, TLT
Best Regards and have another great trading week!
Alexander Berger (www.MasterChartsTrading.com)
Disclaimer, we have:
Open positions: SPY, DUST
New position: SPY, DUST
Closed position: SDS, GDX, GLD, TLT


 RSS Feed